Hi everyone,
I’m working on a project that relies on 2D & 3D plotting within the same visualiser, I’ve gotten pretty far with the inbuilt vtkCharts (vtkChartXY, vtkChartHistogram2D, etc.) and have them working within panels as 2D overlays that integrate with the other 2D widgets in VTK. The plotting is largely fine (was missing errorbar plotting, added it myself) but it looks like the tooltip functionality is lost when using vtkContextActor to embed figures into a scene and the plots lose their interaction.
Is there a way to reimplement the interactor used in vtkContextView and use it in the standard renderer?
I’ve attached some example code modified from the C++ example, you can swap between the two rendering modes pretty easily.
import math
from vtkmodules.vtkCommonColor import vtkNamedColors
from vtkmodules.vtkCommonCore import vtkFloatArray
from vtkmodules.vtkChartsCore import vtkChartXY, vtkPlotPoints
from vtkmodules.vtkCommonDataModel import vtkRectf
from vtkmodules.vtkRenderingContext2D import vtkContextActor, vtkContextScene
from vtkmodules.vtkFiltersSources import vtkSphereSource

import vtkmodules.all as vtk
from vtkmodules.vtkRenderingCore import (
    vtkActor,
    vtkPolyDataMapper,
)

colors = vtkNamedColors()


def main(convert_to_actor=False):

    chart = vtkChartXY()
    chartScene = vtkContextScene()

    chart.SetAutoSize(False)
    chart.SetSize(vtkRectf(0.0, 0.0, 320, 220))

    chartScene.AddItem(chart)

    # Create a table with some points in it
    table = vtk.vtkTable()

    arrX = vtkFloatArray()
    arrX.SetName("X Axis")
    table.AddColumn(arrX)

    arrC = vtkFloatArray()
    arrC.SetName("Cosine")
    table.AddColumn(arrC)

    arrS = vtkFloatArray()
    arrS.SetName("Sine")
    table.AddColumn(arrS)

    arrT = vtkFloatArray()
    arrT.SetName("Tan")
    table.AddColumn(arrT)

    # Test charting with a few more points
    numPoints = 69
    inc = 7.5 / (numPoints - 1.0)
    table.SetNumberOfRows(numPoints)
    for i in range(numPoints):
        table.SetValue(i, 0, i * inc)
        table.SetValue(i, 1, math.cos(i * inc) + 0.0)
        table.SetValue(i, 2, math.sin(i * inc) + 0.0)
        table.SetValue(i, 3, math.tan(i * inc) + 0.5)

    # Add multiple line plots, setting the colors etc.
    color3d = colors.GetColor3d("banana")

    points = chart.AddPlot(vtk.vtkChart.POINTS)
    points.SetInputData(table, 0, 1)
    points.SetColorF(color3d[0], color3d[1], color3d[2])
    points.SetWidth(1.0)
    points = vtkPlotPoints.SafeDownCast(points)
    points.SetMarkerStyle(vtkPlotPoints.CROSS)

    points = chart.AddPlot(vtk.vtkChart.POINTS)
    points.SetInputData(table, 0, 2)
    points.SetColorF(color3d[0], color3d[1], color3d[2])
    points.SetWidth(1.0)
    points = vtkPlotPoints.SafeDownCast(points)
    points.SetMarkerStyle(vtkPlotPoints.PLUS)

    points = chart.AddPlot(vtk.vtkChart.POINTS)
    points.SetInputData(table, 0, 3)
    points.SetColorF(color3d[0], color3d[1], color3d[2])
    points.SetWidth(1.0)
    points = vtkPlotPoints.SafeDownCast(points)
    points.SetMarkerStyle(vtkPlotPoints.CIRCLE)


    link = chartScene.GetAnnotationLink()
    print("Link", link, sorted(dir(link)))

    if convert_to_actor:

        renwin = vtk.vtkRenderWindow()
        renwin.SetMultiSamples(4)
        renwin.SetSize(640, 480)
        renwin.SetWindowName("Chart On 3D Scene")

        iren = vtk.vtkRenderWindowInteractor()
        iren.SetRenderWindow(renwin)

        renderer = vtk.vtkRenderer()
        renderer.SetBackground(colors.GetColor3d("seagreen"))
        renwin.AddRenderer(renderer)

        chartScene.SetRenderer(renderer)

        chartActor = vtkContextActor()
        chartActor.SetScene(chartScene)
        renderer.AddActor(chartActor)

        cube = vtkSphereSource()
        cubeMapper = vtkPolyDataMapper()
        cubeMapper.SetInputConnection(cube.GetOutputPort())
        cubeActor = vtkActor()
        cubeActor.SetMapper(cubeMapper)
        cubeActor.GetProperty().SetColor(colors.GetColor3d("peacock"))
        renderer.AddActor(cubeActor)
        cubeActor.GetProperty().SetRepresentationToSurface()

        renwin.SetMultiSamples(0)
        renwin.Render()
        iren.Initialize()
        iren.Start()

    else:

        figure = vtk.vtkContextView()
        figure.GetRenderWindow().SetWindowName("Chart On 2D Scene")
        figure.GetRenderWindow().SetSize(640, 480)
        figure.GetRenderer().SetBackground(colors.GetColor3d("seagreen"))
        figure.GetRenderWindow().Modified()
        figure.GetScene().AddItem(chart)
        figure.GetInteractor().Initialize()
        figure.GetRenderWindow().Render()
        figure.GetInteractor().Start()


if __name__ == "__main__":
    # main(convert_to_actor=True)
    main(convert_to_actor=False)
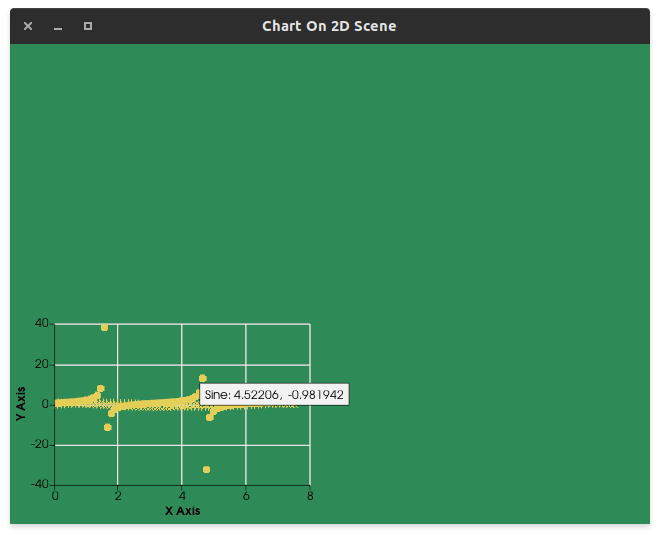
Hopefully you can see the difference, in the 2D scene we get the tooltip, a very useful addition. The figure can be interacted with panning, zooming & selection too.
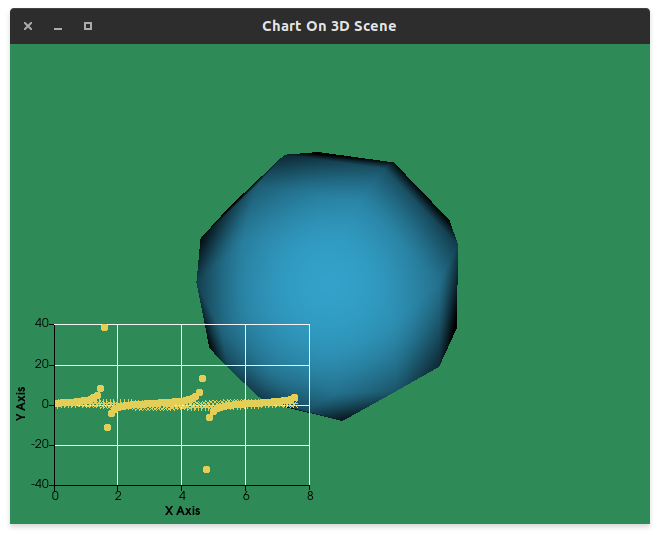
Meanwhile when added to a 3D scene using vtkContextActor the plot is static (though it’s not too hard to move through binding it to another widget and controlling that instead.)
Does anyone have any idea how to add the functionality back in? I can likely make my own tooltip using vtkBorderWidget and vtkTextWidget but don’t know where the tooltip information is populated from, calling GetAnnotationLink() seems to return None.