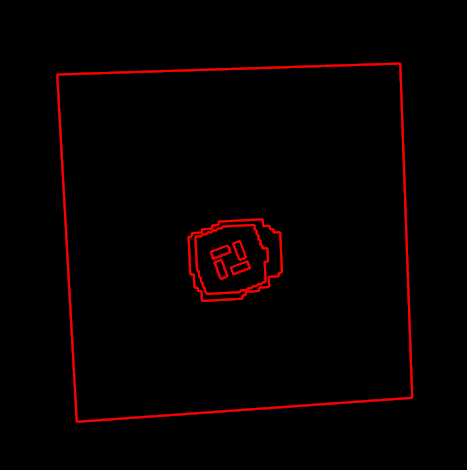
I am trying to visualise some CFD data from a VTU file (exported from XFlow). When I check the results in Paraview Glance it looks like this
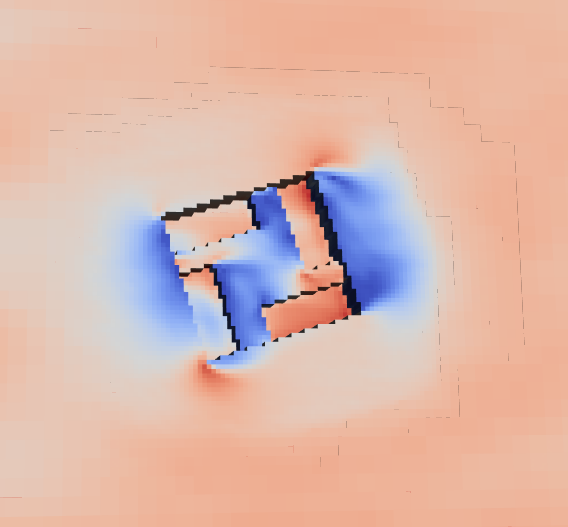
which is correct, however when I load it in VTK and present the same cell data it looks very different
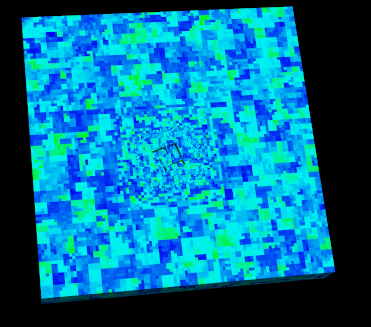
Can anyone explain what could be causing this difference? I’ll paste my code and the vtu file below
Thank you
import vtk

filename = 'data/xfdata000050Average.vtu'

reader = vtk.vtkXMLUnstructuredGridReader()
reader.SetFileName(filename)
reader.Update()

outputData = reader.GetOutput()

geoFilter = vtk.vtkGeometryFilter()
# geoFilter.SetInputConnection(outputData)
geoFilter.SetInputConnection(reader.GetOutputPort())
geoFilter.Update()

polydata = geoFilter.GetOutput()

cellData = outputData.GetCellData().GetArray('VelocityModule')
polydata.GetCellData().SetScalars(cellData)

mapper = vtk.vtkPolyDataMapper()
mapper.SetInputData(polydata)
# mapper.InterpolateScalarsBeforeMappingOn()
mapper.Update()
mapper.SetScalarRange(0.08176144979073013, 10.231158699036726)

actor = vtk.vtkActor()
actor.SetMapper(mapper)
# actor.GetProperty().SetOpacity(0.9)

#RENDERING

renderer = vtk.vtkRenderer()
renderer.AddActor(actor)

renderWindow = vtk.vtkRenderWindow()
renderWindow.AddRenderer(renderer)
renderWindow.SetSize(500,500)

renderWindowInteractor = vtk.vtkRenderWindowInteractor()
renderWindowInteractor.SetRenderWindow(renderWindow)
interactorStyle = vtk.vtkInteractorStyleTrackballCamera()
renderWindowInteractor.SetInteractorStyle(interactorStyle)

renderWindowInteractor.Initialize()
renderWindow.Render()
renderWindowInteractor.Start()
VTU File:
<?xml version="1.0"?>
<VTKFile type="UnstructuredGrid" version="0.1" byte_order="LittleEndian" header_type="UInt32" compressor="vtkZLibDataCompressor">
  <UnstructuredGrid>
    <Piece NumberOfPoints="318083" NumberOfCells="288309">
      <PointData>
      </PointData>
      <CellData>
<DataArray type="Float32" Name="Velocity" NumberOfComponents="3" format="binary" RangeMin="0.08176144979073013" RangeMax="11.816925742550888">
<DataArray type="Float32" Name="VelocityModule" format="binary" RangeMin="0.0817614495754242" RangeMax="11.816926002502441">
<DataArray type="Float32" Name="StaticPressure" format="binary" RangeMin="-713.8722534179688" RangeMax="845.2791137695312">
<DataArray type="Float32" Name="TotalPressure" format="binary" RangeMin="-665.178466796875" RangeMax="856.3762817382812">
<DataArray type="Float32" Name="Vorticity" format="binary" RangeMin="0.013791648671030998" RangeMax="3.3944108486175537">
<DataArray type="Float32" Name="Turbulence" format="binary" RangeMin="3.2348036766052246" RangeMax="70.0313949584961">
</CellData>
      <Points>
        <DataArray type="Float32" Name="Vertex" NumberOfComponents="3" format="binary" RangeMin="0" RangeMax="718.9575787207476">
     </Points>
      <Cells>
        <DataArray type="Int64" Name="connectivity" format="binary" RangeMin="0" RangeMax="318082">
<DataArray type="Int64" Name="offsets" format="binary" RangeMin="8" RangeMax="2306472">
<DataArray type="UInt8" Name="types" format="binary" RangeMin="11" RangeMax="11">
      </Cells>
    </Piece>
  </UnstructuredGrid>
</VTKFile>