I am trying to color a vtkPolyData by looping through the z-axis, and then see if the width of a slice(i) is < or > to a certain value. And then color the slice (over the z-axis) according to this threshold.
Below is the code that I am working on. But the instead of color the slice (over z-axis) it color the slice over (x-axis).
import vtk, sys
import statistics
# Read in your STL file
f = vtk.vtkSTLReader()
f.SetFileName("my_stl_file.stl")
f.Update() # This is necessary to have the data ready to read.

# The vtkSTLReader reads in your file as a vtkPolyData, 'obj' is a reference to
# that output. I'm using the bounds that are automatically calculated during
# the import phase to give a range for the height of the points in the file.v
# I believe that the bounds are (xmin, xmax, ymin, ymax, zmin, zmax).
obj = f.GetOutputDataObject(0)
min_x , max_x , min_y , max_y ,min_z, max_z = obj.GetBounds()
# I am creating a lookup table to correspond to the height field. I am using
# the default values. Remember that the lookup table is a rather complex and
# handy object, and there are lots of options to set if you need something
# special.
lut_z = vtk.vtkLookupTable()
lut_z.SetTableRange(min_z, max_z)
lut_z.Build()


# This is an array that I am creating to store the heights of the points. I
# will use this as a scalar field on the 'obj' so that the lookup  table can be
# used to color it. You could obviously make the array anything you wanted,
# such as ‘x’ or ‘y’ or squared distance from some other point, for instance.


heights = vtk.vtkDoubleArray()
heights.SetName("Z_Value")

width = vtk.vtkDoubleArray()
width.SetName("X_Value")
# Loop through the points in the vtkPolyData and record the height in the
# 'heights' array.
Colors = vtk.vtkUnsignedCharArray()
Colors.SetNumberOfComponents(3)
Colors.SetNumberOfTuples(obj.GetNumberOfCells())
test_xyz = []
test_z = []

for i in range(obj.GetNumberOfPoints()) :
    xyz = obj.GetPoint(i)
    test_xyz.append(xyz)
        if min_x < xyz[0] < 300 :
        Colors.InsertTuple3(i,0, 255, 0) # it adding colormap to the x-axis instead of z-axis
    else :
        Colors.InsertTuple3(i,255,0 , 0) # it adding colormap to the x-axis instead of z-axis


obj.GetPointData().SetScalars(Colors)


mapper = vtk.vtkPolyDataMapper()
mapper.SetInputDataObject(obj)
mapper.SetScalarRange(obj.GetScalarRange())
mapper.SetLookupTable(lut_z)
mapper.SetUseLookupTableScalarRange(True)

actor = vtk.vtkActor()
actor.SetMapper(mapper)

renderer = vtk.vtkRenderer()
renderer.AddActor(actor)
renderer.SetBackground(.1, .2, .4)

renw = vtk.vtkRenderWindow()
renw.AddRenderer(renderer)

iren = vtk.vtkRenderWindowInteractor()
iren.SetRenderWindow(renw)

renw.Render()
iren.Start()
You are setting your colors according to a condition on the X coordinate:
    if min_x < xyz[0] < 300 :
        Colors.InsertTuple3(i,0, 255, 0) # it adding colormap to the x-axis instead of z-axis
    else :
        Colors.InsertTuple3(i,255,0 , 0) # it adding colormap to the x-axis instead of z-axis
If you want to conditionally set your Colors array depending on your Z coordinate, you should test on xyz[2] instead of xyz[0].
Perhaps I don’t quite understand what you are trying to do. Do you think it might be possible for you to provide a sketch of what you would like to obtain or maybe the equivalent case in 2D ?
I want to color a 3D object using width and height.
For this matter, I want to parse through each slice (around z-axis) and check if the value of the corresponding x coordinate is > or < to a certain threshold.
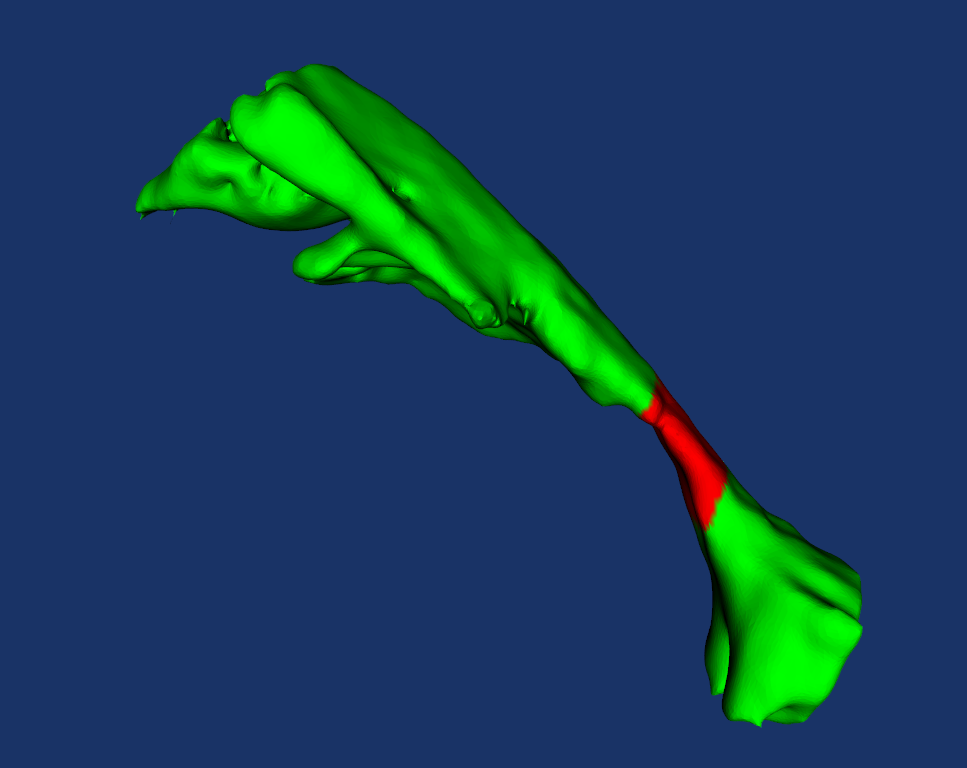
if x > threshold => then color the slice (z-axis) in green
if x < threshold => then color the slice (z-axis) in red
The following figure is the desired output. Thank you
Let me be more precise in trying to get to the root of the matter: When iterating over slices of constant z (z = a) there are multiple points that correspond to this slice (i.e. if the underlying object is a 2D surface, a slice will be a 1D curve). All these points have the same z value but not the same x or y values (if they did, they would all be the same point and not a curve).
As such, which point would you like to use to test the x value?
If you would like to test all the points, than you risk not coloring the slice homogeneously (what I believe is happening now in your script). If you do some sort of average than you risk coloring some points with a color even though they do not respect your condition. A minimum or maximum operation on all the points might be the best alternative but could also be quite restrictive.
If you are trying to extract a given zone of your object, you might want to look at the vtkThreshold filter for automating this task. Or perhaps create some vtkSelection of your zone and use the vtkExtractSelection filter.