Hello!!
I’m working on this example https://pastebin.com/reu0dXYj and i want to add intensity value for each point. I know i need to use a lookup table and i think i should use a vtk.vtkFloatArray() with intesity component or vtk.vtkUnsignedCharArray() with R,G,B values. Can someone please give me an example, from where to start … or some useful guidelines?
What exactly do you mean by “intensity value”? Can you share a sample point cloud file to which you’d like to do this?
I have files with x, y, z, coordinates and an intensity value for each point.
for example:145 221 448 31.
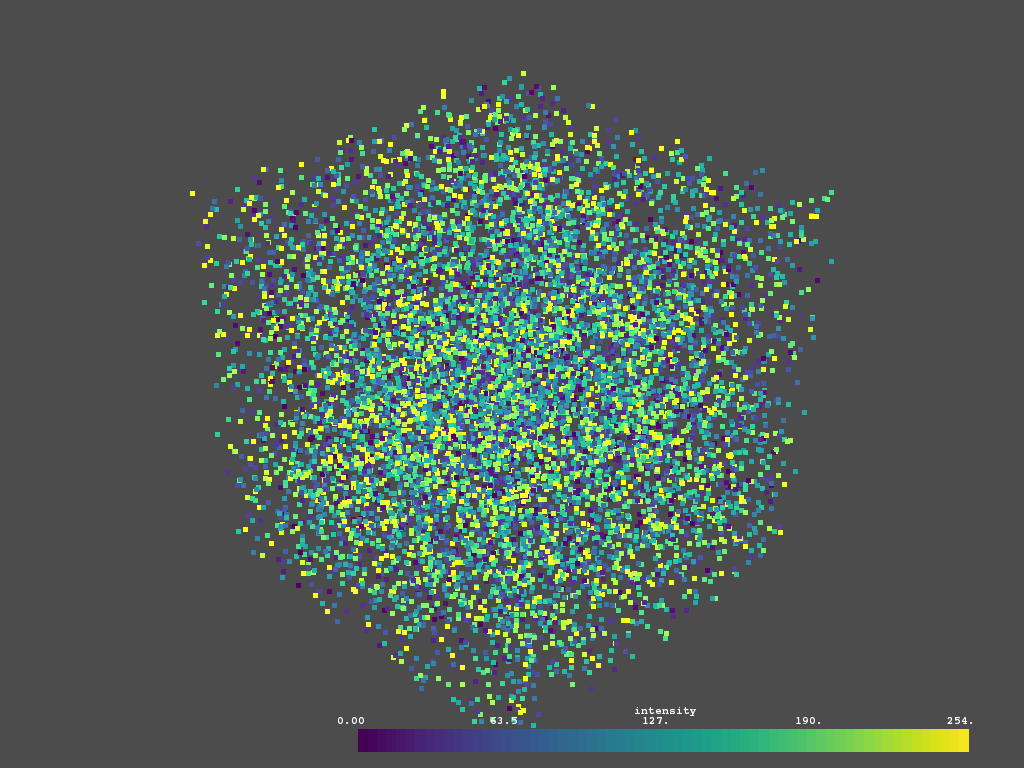
If you simply want to color the “intensity” values, then check out vtki:
import numpy as np
import vtki

# Load your point cloud
n = 10000
points = np.random.rand(n, 3)
intensity = np.random.randint(0, 255, n)

# Create a VTK dataset
poly = vtki.PolyData(points)
poly.point_arrays['intensity'] = intensity

# Plot the point cloud
poly.plot(cmap='viridis')
Thank you for your response, but I need to use vtk, and adding intensity to the points is just a step from the entire process
vtki is VTK. It simply adds a layer on top to make VTK way easier to use so that we don’t have to remember the nuances of lookup tables and rendering, etc.
All vtki data objects are instances of VTK data objects:
>>> import vtk
>>> import vtki
>>> isinstance(vtki.PolyData(), vtk.vtkPolyData)
True
>>> isinstance(vtki.UnstructuredGrid(), vtk.vtkUnstructuredGrid)
True
- You’ll need to create a mapper:
vtk.vtkDataSetMapper() - Then set up that mappers lookup table properly:
mapper.GetLookupTable()and set its attributes/colormapping
Try following this example or this cpp exmaple which could be translated to Python