I’ve subclassed vtkAbstractPolyDataReader to MyReader, which reads topographic data from a file and outputs vtkPolyData containing points and polygons (triangles). I’ve written an app that uses MyReader to read a topographic data file and display it as a 3D surface, colorized by elevation, like so:
// Read topographic data
vtkSmartPointer<MyReader> reader =
   vtkSmarPointer<MyReader>::New();
reader->Update();

// Want to colorize topographic data by elevation
vtkSmartPointer<vtkElevationFilter> colorizer =
  vtkSmartPointer<vtkElevationFilter>::New();

colorizer->SetInputConnection(reader->GetOutputPort());
[and so on]
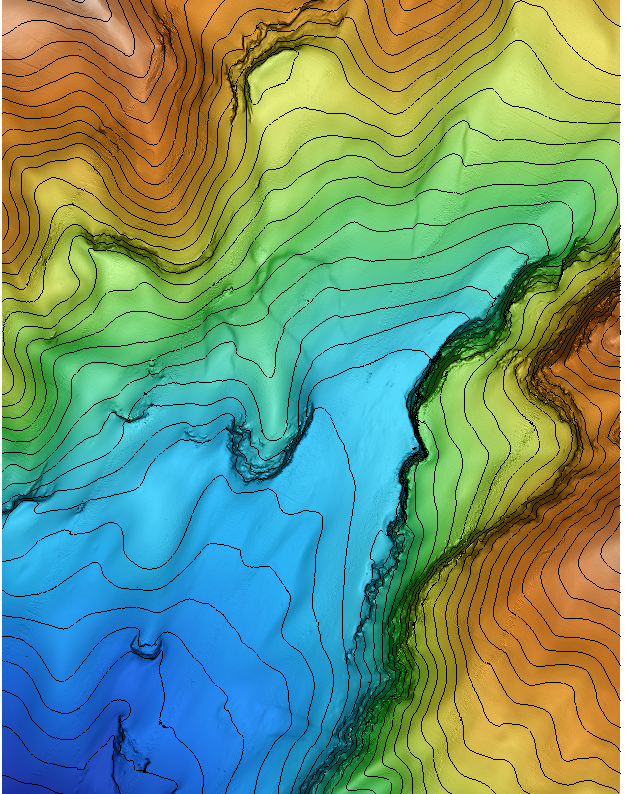
For example, the first image (below) is colored by elevation (depth) of Monterey Canyon - blue is deep, yellow-orange are shallow.
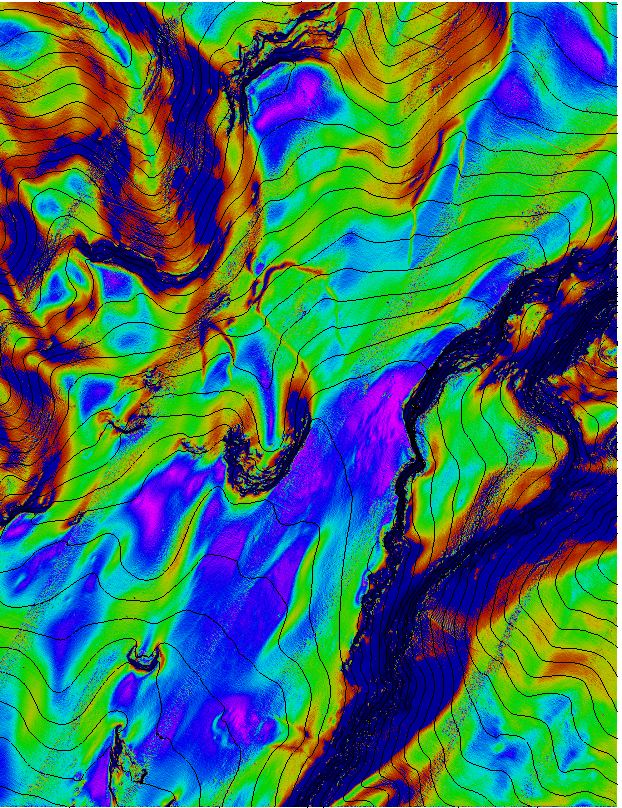
Now I want my app to colorize by slope gradients, as shown in the second image of Monterey Canyon; red are the steepest slopes, blue (on the canyon floor) is nearly flat.
I think I can do this somehow with vtkGradientFilter, but I’m not sure where to begin. The few examples I’ve seen - VTKExamples Gradient and GradientFilter are not very clear to me. Could anyone advise on how I would change my app to achieve this?
Thanks!
I’ve made changes to your pipeline (signaled with a //<-------------------). I didn’t have time to test it, so read it to see whether it makes sense for you, then give it a try. It’s likely it won’t work in your first attempt, but that’s a kickstart.
Hi @Paulo_Carvalho - thanks very much for your suggestions! I incorporated them into my code. When I run my app I see about a 15 second delay before the surface is displayed, presumably because the gradient filter is computing slopes (dataset consists of 1113 x 1450 points). However the final displayed surface colors are identical to elevation colors, i.e. they don’t reflect the gradient. Why might that be?
Also, if I want to color the surface by gradient and not by elevation, why does my pipeline need to include an elevation filter?
Here is the current code:
  vtkSmartPointer<mb_system::GmtGridReader> reader =
     vtkSmartPointer<mb_system::GmtGridReader>::New();

   reader->SetFileName ( filePath.c_str() );
   reader->Update();

   float zMin, zMax;
   reader->zBounds(&zMin, &zMax);

   // Color data points based on z-value
   vtkSmartPointer<vtkElevationFilter> elevationFilter =
     vtkSmartPointer<vtkElevationFilter>::New();

   elevationFilter->SetInputConnection(reader->GetOutputPort());

   elevationFilter->SetLowPoint(0, 0, zMin);
   elevationFilter->SetHighPoint(0, 0, zMax);

   vtkSmartPointer<vtkGradientFilter> gradientFilter =
     vtkSmartPointer<vtkGradientFilter>::New();

   gradientFilter->SetInputConnection(elevationFilter->GetOutputPort());

   // Visualize the data...
   // Create renderer
   vtkSmartPointer<vtkRenderer> renderer =
      vtkSmartPointer<vtkRenderer>::New();

   // Create mapper
   vtkSmartPointer<vtkPolyDataMapper> mapper =
      vtkSmartPointer<vtkPolyDataMapper>::New();

   mapper->SetInputConnection(gradientFilter->GetOutputPort());

   if (useLUT) {
     zMin = gradientFilter->GetOutput()->GetScalarRange()[0];
     zMax = gradientFilter->GetOutput()->GetScalarRange()[1];

     vtkSmartPointer<vtkLookupTable> lut =
             vtkSmartPointer<vtkLookupTable>::New();

     makeLUT(colorScheme, lut);

     mapper->SetScalarRange(zMin, zMax);
     mapper->ScalarVisibilityOn();
     mapper->SetLookupTable(lut);
   }

   // Create actor
   vtkSmartPointer<vtkActor> actor =
      vtkSmartPointer<vtkActor>::New();

   // Assign mapper to actor
   actor->SetMapper(mapper);
   renderer->AddActor(actor);

   // Create renderWindow
   vtkSmartPointer<vtkRenderWindow> renderWindow =
     vtkSmartPointer<vtkRenderWindow>::New();

   // Add renderer to the renderWindow
   renderWindow->AddRenderer(renderer);
Attack one problem at a time. It seems that the vtkDataSet in the output of the gradient filter has two or more scalars and the first field (the default one) is probably the one with elevation values. You have to change your pipeline to use the one with the gradient values (e.g. with gradientFilter->GetOutput()-> [ GetPointData() | GetCellData() ] ->SetActiveScalars('myScalarField').
Thank you @Paulo_Carvalho - sorry , I really am a novice and I really appreciate your advice. How do I know what data is available from the gradientFilter, i.e. how many scalar fields, and how do I know to choose gradientFilter’s GetPointData() versus GetCellData()? When I’ve made that choice then from other examples it seems the pattern is this:
vtkGradientFilter's GetOutput() returns a pointer to a vtkDataSet. A vtkDataSet is a very generic class than can be a point cloud, a polygonal line, a grid, a tetrahedron mesh, you name it. Here’s the documentation of vtkDataSet: https://vtk.org/doc/nightly/html/classvtkDataSet.html . See how many subclasses it has. Quite a lot! We can assume that the filter returns a data set with the same sub-type as the input’s. This is just to introduce you to the basics of VTK design. It’s not really relevant to your problem.
Now to the difference between GetPointData() versus GetCellData(). The former is a pointer to the data values stored in the points of your object and the latter points to the values stored in “cells”. The points are like “atoms” in XYZ space. A “cell” is a construct of “atoms”. A “cell” is made of one or more “atoms”. “Cells” can share “atoms” to optimize de model. A vtkVertex is a “cell” made with just one point. So you can say a point cloud is made of cells of type vtkVertex, each defined by a single point. Other types of “cells” are lines, triangles, cubes, etc. So, the data can reside directly in the points and/or in the cells. You have to know your input data set or simply test it to see where your reader is putting the data values.
For how many fields your data set has, you can try something like this:
vtkDataSet* dataSet = gradientFilter->GetOutput();
vtkCellData* cellData = dataSet->GetCellData();
vtkDataArray* dataArray = cellData->GetScalars();
std::cout << "My data set's cells have " << dataArray->GetNumberOfComponents() << " scalar field(s)." << std::endl;
I hope this helps to cast some light on VTK data sets.
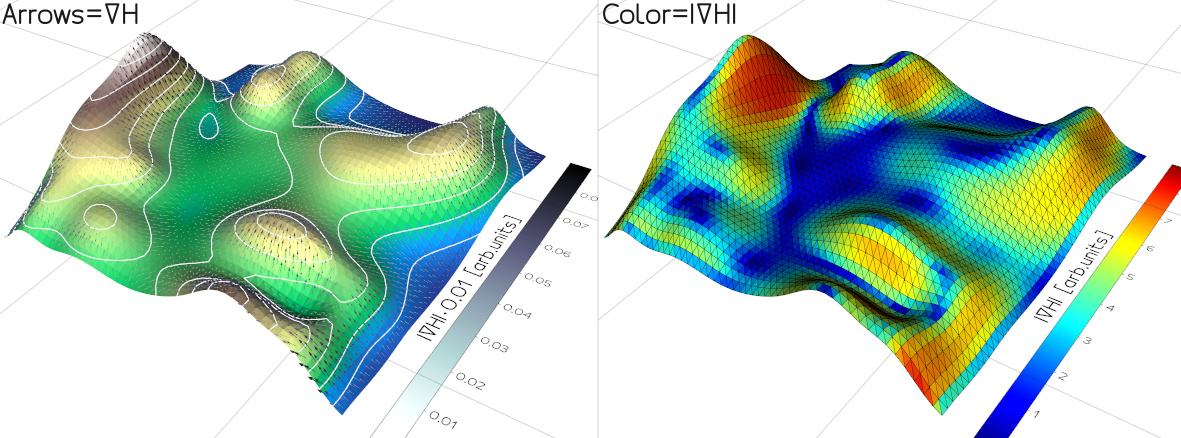
Thanks very much @marcomusy, this code is very useful. I’ve implemented your python gradient() function in C++, but I don’t quite understand how this section of isolines.py works - in particular, how exactly do you put the gradient colormap directly on the hillside mesh? Can you describe that process strictly in terms of the VTK C++ library? Many thanks!
gvecs = mesh.gradient('Scalars', on='cells')
cc = mesh.cellCenters()
ars = Arrows(cc, cc + gvecs*0.01, c='bone_r').lighting('off')
ars.addScalarBar3D(title='|\nablaH|~\dot~0.01 [arb.units]')
show(mesh, isol, ars, "Arrows=\nablaH", at=2)

# colormap the gradient magnitude directly on the mesh
mesh2 = mesh.clone().lw(0.1).cmap('jet', mag(gvecs), on='cells')
mesh2.addScalarBar3D(title='|\nablaH| [arb.units]')
cam = dict(pos=(2.57, -1.92, 3.25), # get these nrs by pressing C
           focalPoint=(0.195, 1.06, 8.65e-3),
           viewup=(-0.329, 0.563, 0.758),
           distance=5.00,
           clippingRange=(1.87, 8.79))
show(mesh2, "Color=|\nablaH|", at=3, camera=cam, interactive=True)
Once you have the vtk array, you create a vtkLookupTable which defines the color associated to the scalar and pass it to the mapper; pass the array to either cells or vertices (see detailed explanation by Paulo). Something like
        lut = vtk.vtkLookupTable()
        lut.SetNumberOfTableValues(ncols)
        for i, c in enumerate(...):
                lut.SetTableValue(i, r, g, b, alpha)
        lut.Build()

        mapper.SetLookupTable(lut)
        mapper.ScalarVisibilityOn()
        mapper.SetScalarRange(vmin, vmax)
        #poly.GetCellData().SetScalars(arr)
        poly.GetCellData().SetActiveScalars(arrayName)
        #poly.GetCellData().Modified()
Sorry, I’m still struggling a bit…
In your pseudocode, “mapper” holds the poly data for the x,y,z terrain points, right? Where is the terrain gradient data generated by vtkGradientFilter.GetOutput() in this code - is it “poly”? I am still missing how you overlay the gradient colors onto the 3D terrain surface.
So when you say poly is the vtkPolyData, you mean poly is the vtkGradientFilter output? I don’t see where poly is connected to the mapper in the pseudo code though (sorry, I’m sounding dumb even to myself at this point ). Really appreciate your help!
 ). Really appreciate your help!