In opengl how can i create plots like this
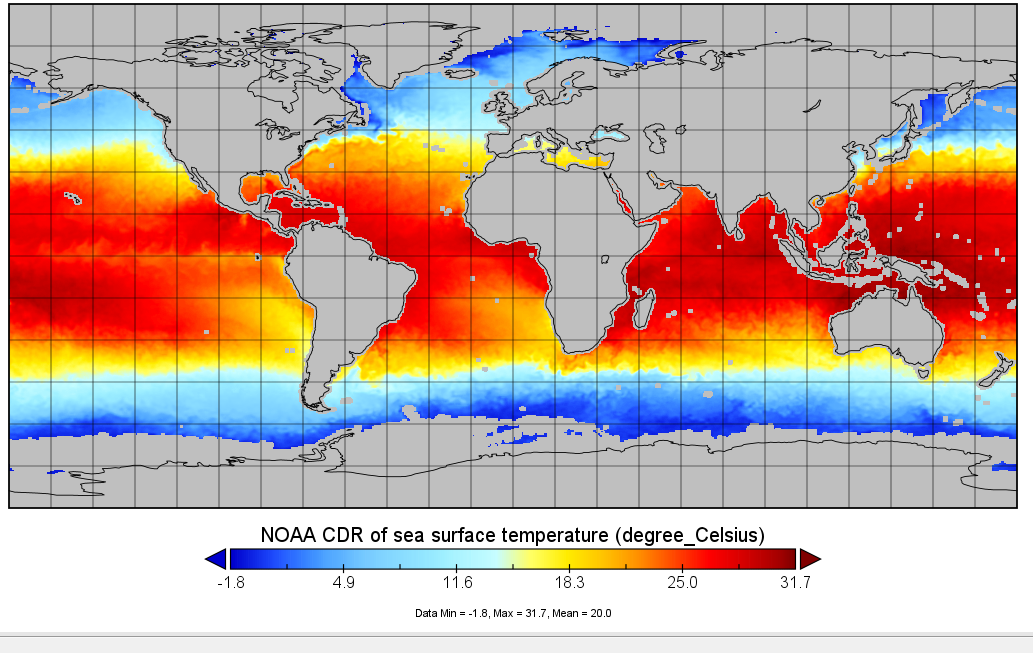
using this code
          vtkSmartPointer<vtkNetCDFCFReader> reader = vtkSmartPointer<vtkNetCDFCFReader>::New();
    reader->SetFileName("C:/Users/admin/Desktop/BOLTgui/BOLT/SEAFLUX-OSB-CDR_V02R00_SST_D20210101_C20210530.nc");
    reader->Update();

    vtkDataObject* dataObject = reader->GetOutput();
    vtkDataSet* dataSet = vtkDataSet::SafeDownCast(dataObject);
    vtkPointData* pointData = dataSet->GetPointData();

    vtkDataArray* latArray = pointData->GetArray("lat");
    vtkDataArray* lonArray = pointData->GetArray("lon");
    vtkDataArray* sstArray = pointData->GetArray("sea_surface_temperature");
    vtkDataArray* timeArray = pointData->GetArray("time");

    vtkSmartPointer<vtkContourFilter> contourFilter = vtkSmartPointer<vtkContourFilter>::New();
    contourFilter->SetInputConnection(reader->GetOutputPort());
    contourFilter->SetValue(0, 20); // set iso-value
    contourFilter->Update();

    vtkSmartPointer<vtkLookupTable> lookupTable = vtkSmartPointer<vtkLookupTable>::New();
    lookupTable->SetNumberOfTableValues(256);
    lookupTable->Build();
    lookupTable->SetTableRange(contourFilter->GetOutput()->GetScalarRange());

    vtkSmartPointer<vtkColorTransferFunction> colorTransferFunction = vtkSmartPointer<vtkColorTransferFunction>::New();
    colorTransferFunction->AddRGBPoint(0.0, 0.0, 0.0, 1.0); // blue
    colorTransferFunction->AddRGBPoint(20.0, 0.0, 1.0, 0.0); // green
    colorTransferFunction->AddRGBPoint(40.0, 1.0, 1.0, 0.0); // yellow
    colorTransferFunction->AddRGBPoint(60.0, 1.0, 0.0, 0.0); // red

    vtkSmartPointer<vtkPolyDataMapper> mapper = vtkSmartPointer<vtkPolyDataMapper>::New();
    mapper->SetInputConnection(contourFilter->GetOutputPort());
    mapper->SetLookupTable(lookupTable);
    mapper->UseLookupTableScalarRangeOn();

    mapper->ScalarVisibilityOn();
    mapper->SetScalarModeToUsePointData();
    mapper->SetLookupTable(lookupTable);
    mapper->SetLookupTable(colorTransferFunction);

    vtkSmartPointer<vtkActor> actor = vtkSmartPointer<vtkActor>::New();
    actor->SetMapper(mapper);

    vtkSmartPointer<vtkRenderer> renderer = vtkSmartPointer < vtkRenderer>::New();
    renderer->AddActor(actor);

    vtkSmartPointer<vtkRenderWindow> renderWindow = vtkSmartPointer<vtkRenderWindow>::New();
    renderWindow->AddRenderer(renderer);

    vtkSmartPointer<vtkRenderWindowInteractor> interactor = vtkSmartPointer<vtkRenderWindowInteractor>::New();
    interactor->SetRenderWindow(renderWindow);

    sf::WindowHandle handle = window.getSystemHandle();
    renderWindow->SetWindowInfo(reinterpret_cast<char*>(handle));
    interactor->Start();

       // Draw triangles
        glBegin(GL_TRIANGLES);
        glPointSize(0.111f);

        // Calculate scaling factor
        float scalingFactor = 1.0f / 2.111f;

        vtkSmartPointer<vtkDataSet> data = vtkDataSet::SafeDownCast(reader->GetOutput());
        for (vtkIdType i = 0; i < data->GetNumberOfCells(); i++) {
            vtkCell* cell = data->GetCell(i);
            vtkPoints* points = cell->GetPoints();
            double point1[3];
            double point2[3];
            double point3[3];
            points->GetPoint(0, point1);
            points->GetPoint(1, point2);
            points->GetPoint(2, point3);
            // Scale the point coordinates to adjust the size
            glVertex3f(point1[0] * scalingFactor, point1[1] * scalingFactor, point1[2] * scalingFactor);
            glVertex3f(point2[0] * scalingFactor, point2[1] * scalingFactor, point2[2] * scalingFactor);
            glVertex3f(point3[0] * scalingFactor, point3[1] * scalingFactor, point3[2] * scalingFactor);
        }
        glEnd();
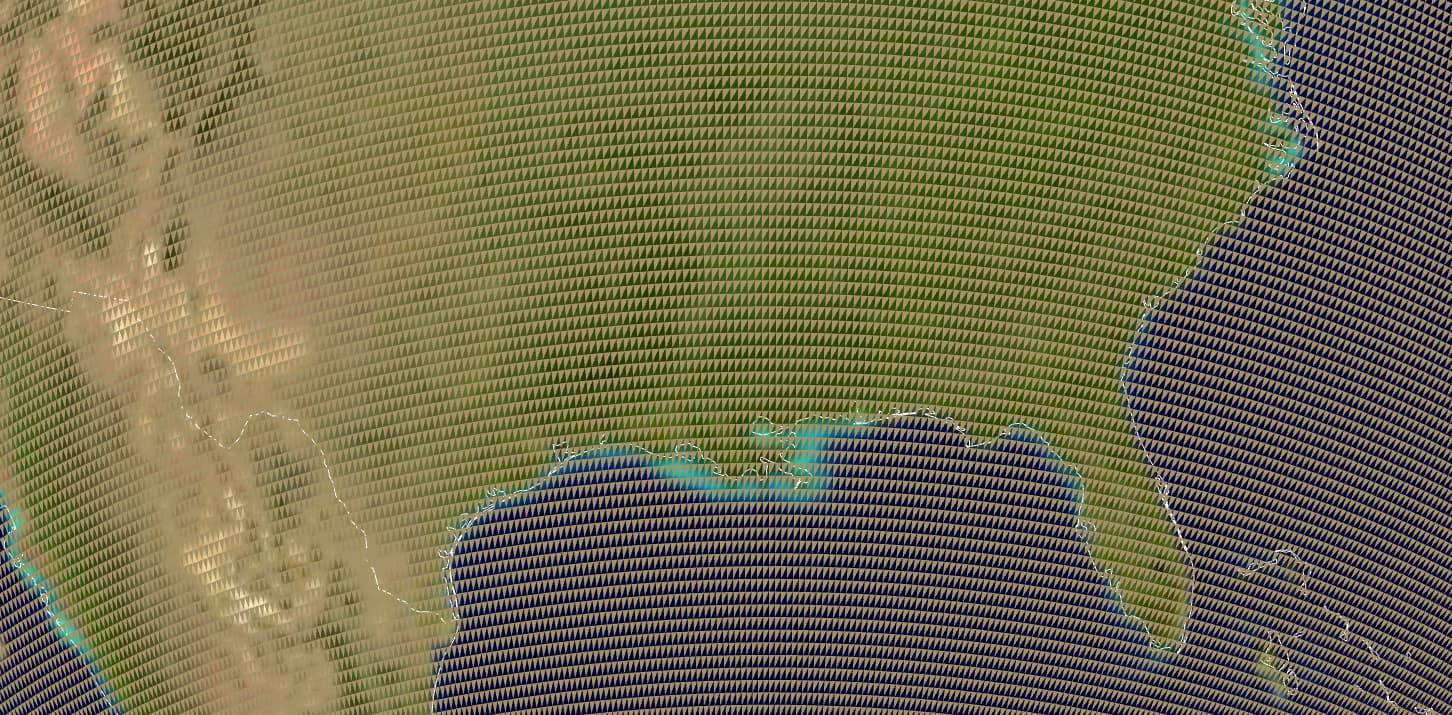
this is what i currently have