Hello,
We are working on a Neuron tracing application. At this stage, visualizing neuron model data (as simple polylines and spheres for the soma) works nicely.
We are now at a stage where we want to look at the neurons together with actual brain volume data.
We have two tiffstacks of actual brain data, one is grayscale and one is color. The greyscale stack is composed of 456 slices, 528x320 pixels and is 8-bit.
The color stack is also 456 slices, 528x320 pixels and is RGB.
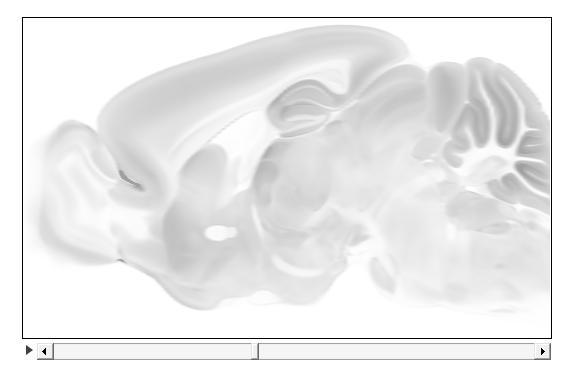
A slice of the grey stack looks like this (in ImageJ):
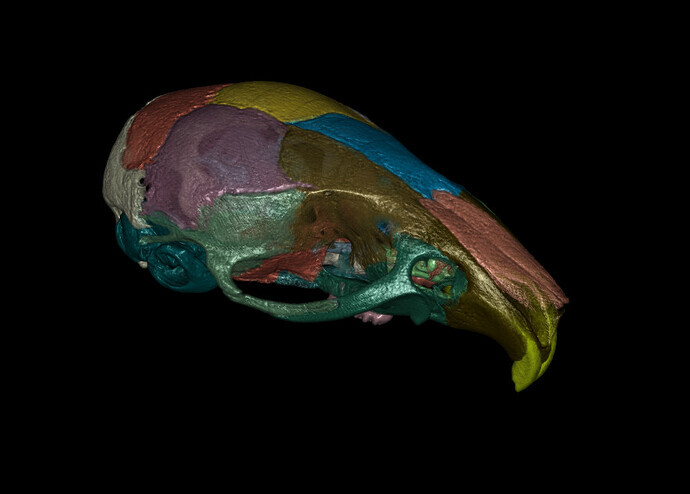
And a slice for the colored stack looks like this:
I have deduced that there are 87 different colors in the colored stack, and I have a list of their exact values.
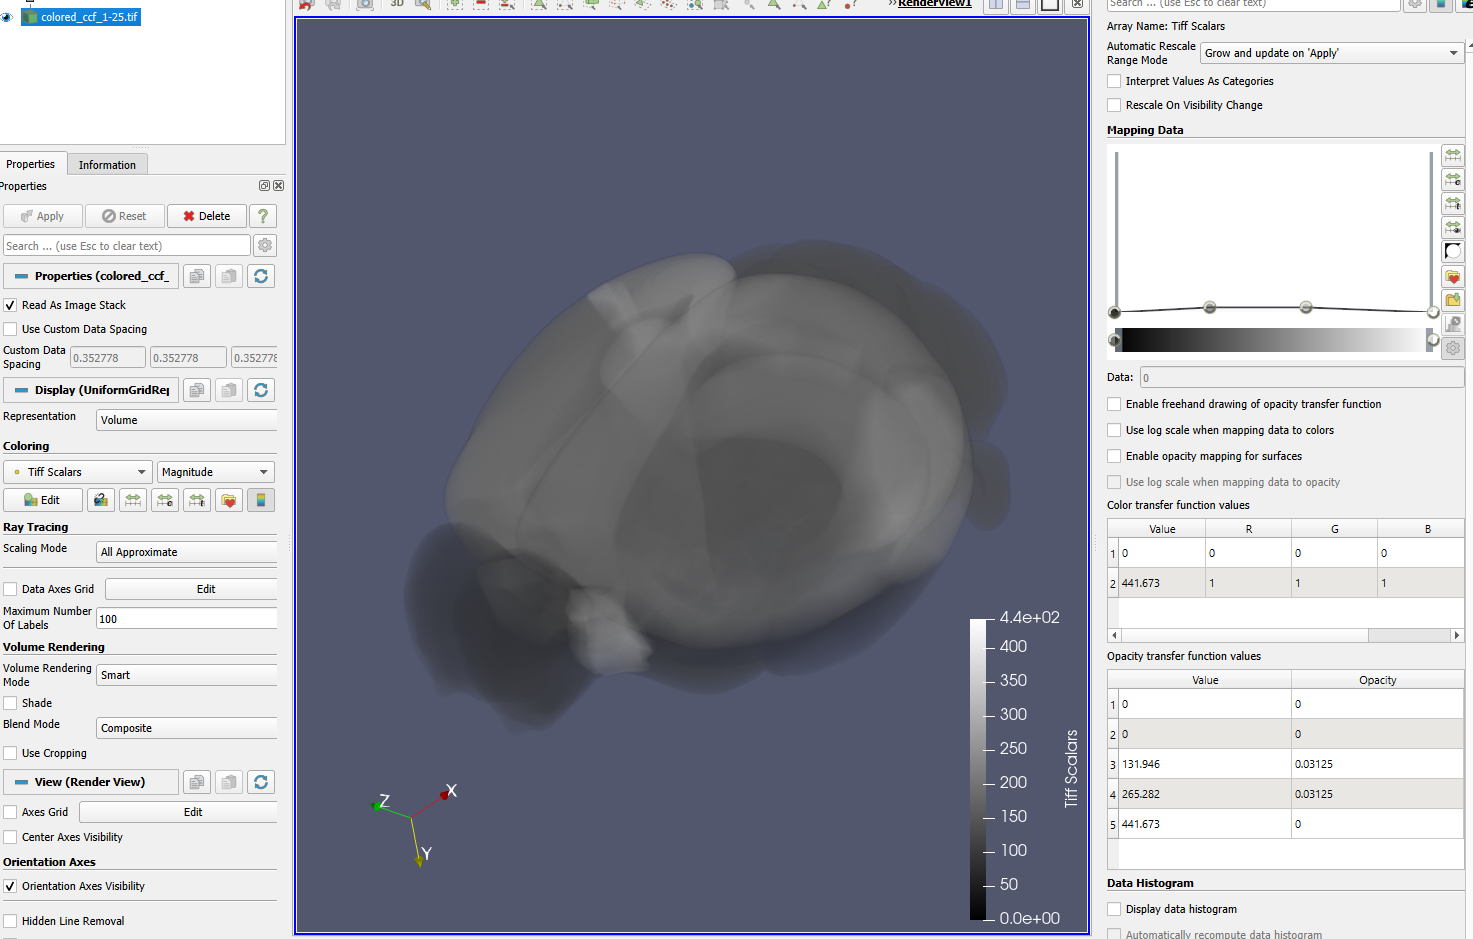
Opening the greyscale volume in Paraview, selecting TiffSeries as input, and choosing representation to ‘Volume’ give me this:
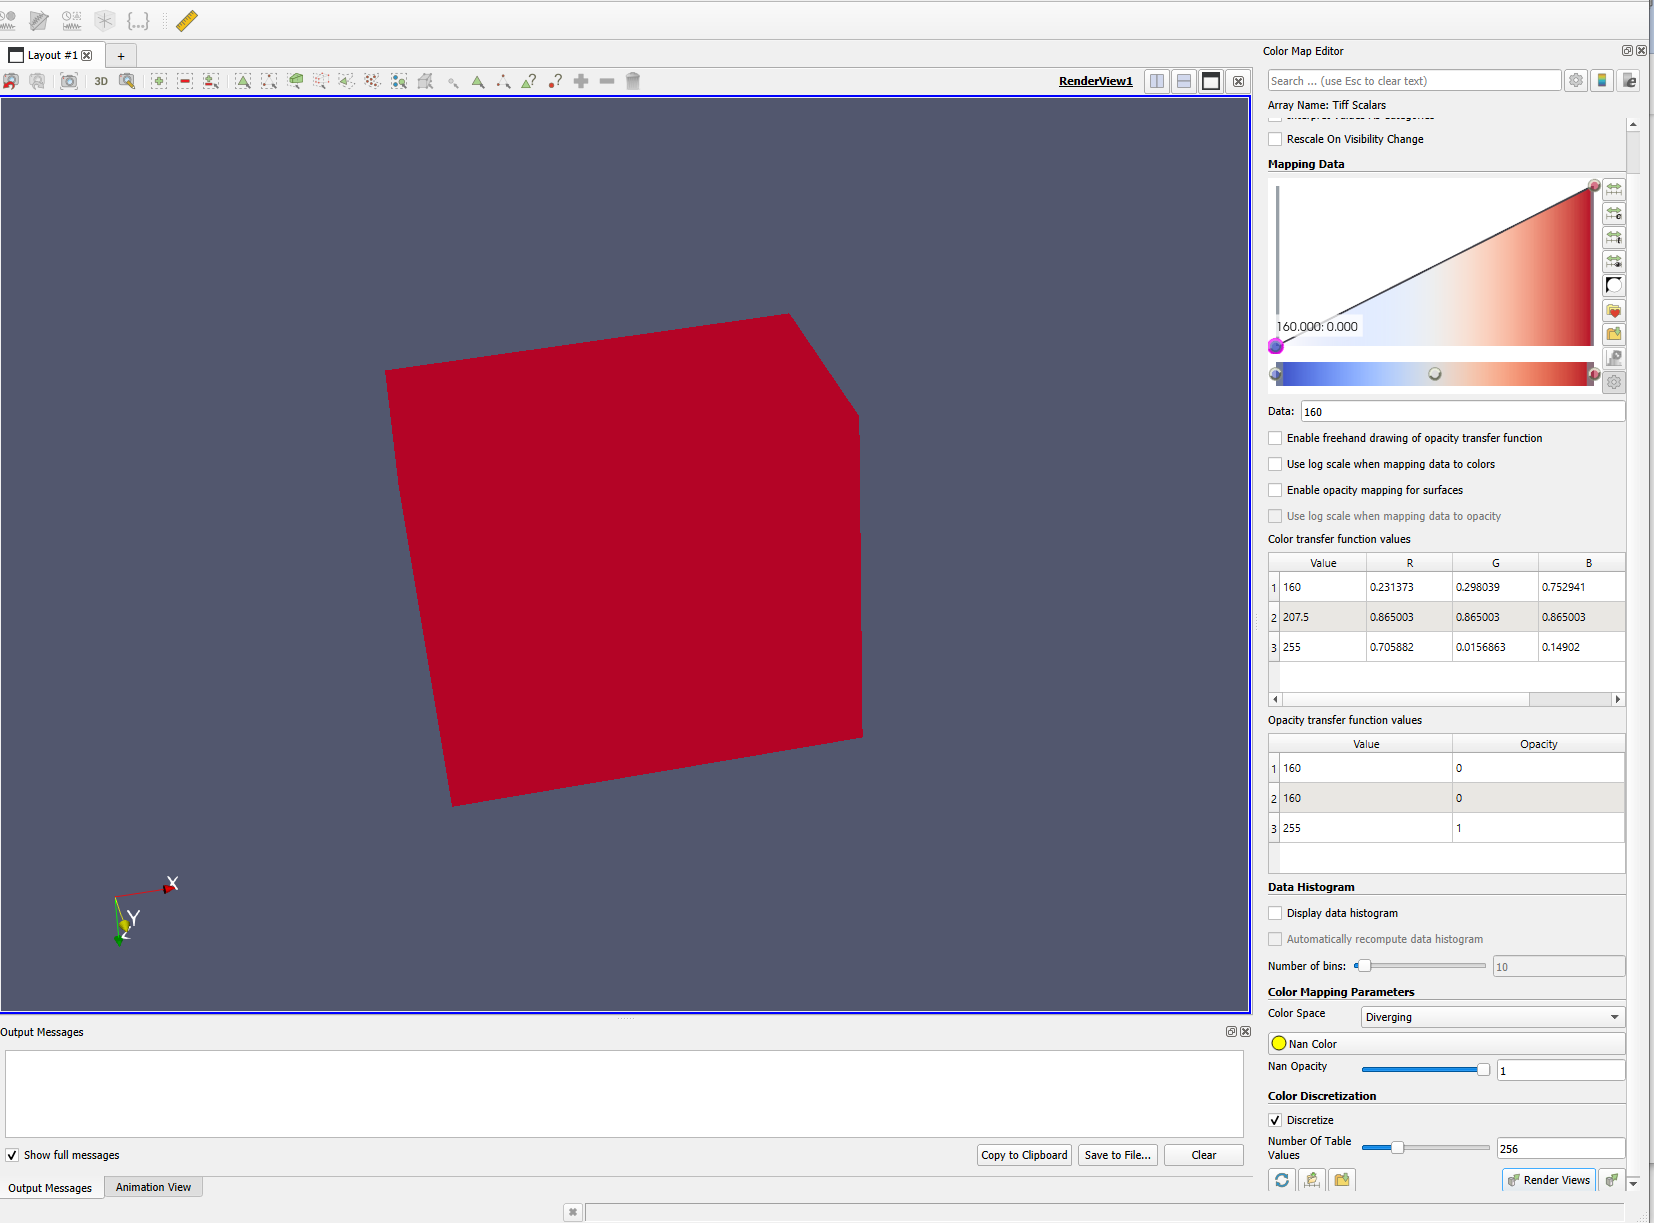
Selecting the grey scale ‘preset’ and a quick edit in the ‘Mapping data’ region of paraview gives this:

This is the kind of view we are looking for, allowing us to see rendered polylines inside.
Looking on examples and on the web, to get the proper view, one need to set the opacity and color transfer functions properly. The following python script, is trying to use the numbers for these functions, from paraview (as in the screenshot), and is based on examples that I found online
Script:
import vtk

filename = 'C:\\ProgramData\\AIBS_MPE\\arboreta\\data\\BrainTemplates\\grayscale_ccf_1-25.tif'
ren1 = vtk.vtkRenderer()

renWin = vtk.vtkRenderWindow()
renWin.AddRenderer(ren1)

iren = vtk.vtkRenderWindowInteractor()
iren.SetRenderWindow(renWin)

reader = vtk.vtkTIFFReader()
reader.SetFileName(filename)

opacityTransferFunction = vtk.vtkPiecewiseFunction()
opacityTransferFunction.AddPoint(160, 0)
opacityTransferFunction.AddPoint(187.783, 0.06875)
opacityTransferFunction.AddPoint(255, 0)

colorTransferFunction = vtk.vtkColorTransferFunction()
colorTransferFunction.AddRGBPoint(160, 0.0, 0.0, 0.0)
colorTransferFunction.AddRGBPoint(255, 1.0, 1.0, 1.0)

volumeProperty = vtk.vtkVolumeProperty()
volumeProperty.SetColor(colorTransferFunction)
volumeProperty.SetScalarOpacity(opacityTransferFunction)
volumeProperty.SetInterpolationTypeToLinear()

volumeMapper = vtk.vtkSmartVolumeMapper()
volumeMapper.SetInputConnection(reader.GetOutputPort())

volumeMapper.SetBlendModeToComposite()

volume = vtk.vtkVolume()
volume.SetMapper(volumeMapper)
volume.SetProperty(volumeProperty)

ren1.AddVolume(volume)
ren1.ResetCamera()
renWin.SetSize(600, 600)
renWin.Render()

iren.Start()
We get a nice view from this!:
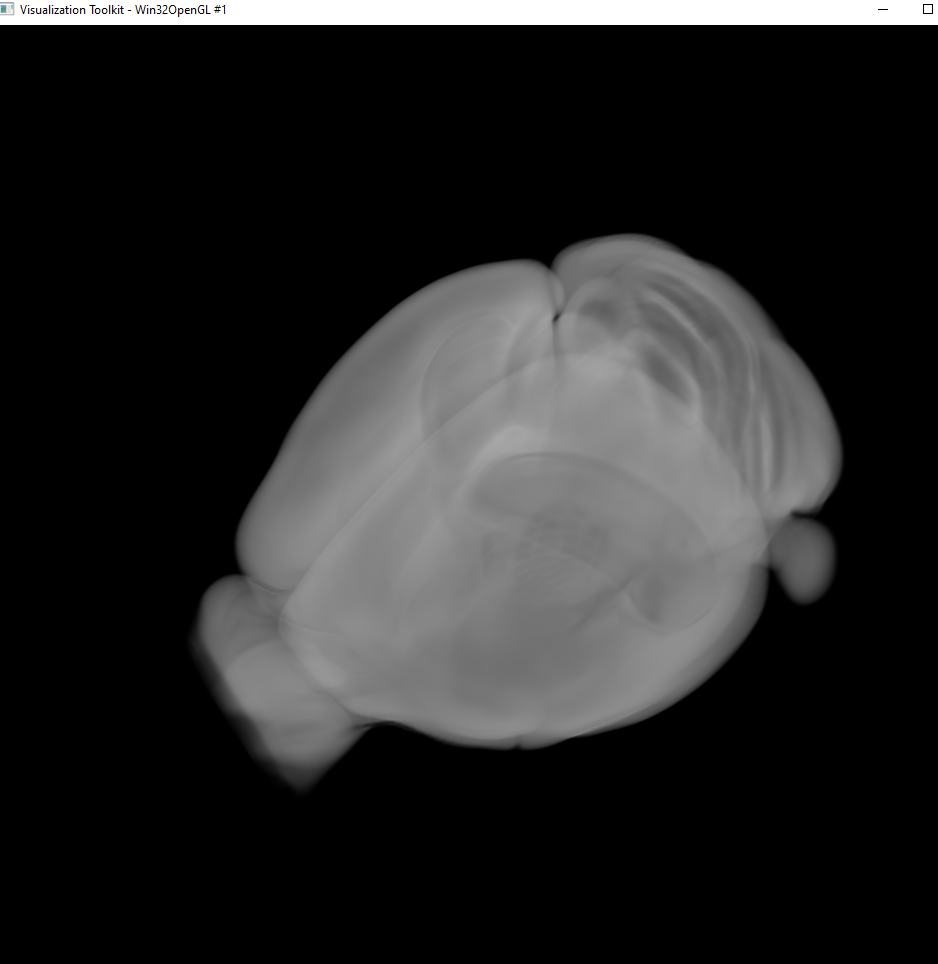
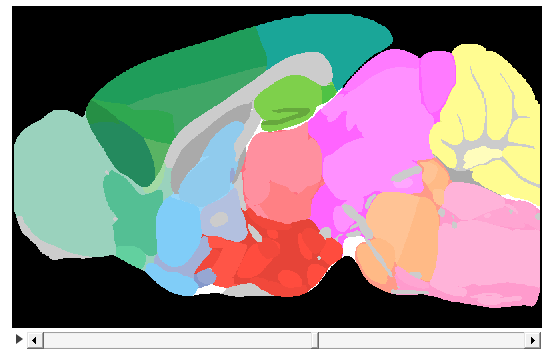
However, when loading the colored stack, Paraview shows this:
and plugging the opacity and color transfer values from paraview into the python script, gives this:

Which is mainly black with no opacity.
So it seems Paraview is doing ‘something’ that one can’t capture from the Paraview UI, when loading a colored stack? Any clues how to get the colored tiffstack to show ‘ok’ using Python?
We would ultimately want that the colored volume uses the colors that is ‘inside’ with opacity. But perhaps I got the ‘colors’ inside wrong, as I suspect the color transfer function is mapping intensities to colors, but not sure, as I have not worked with these classes before.
Best Regards