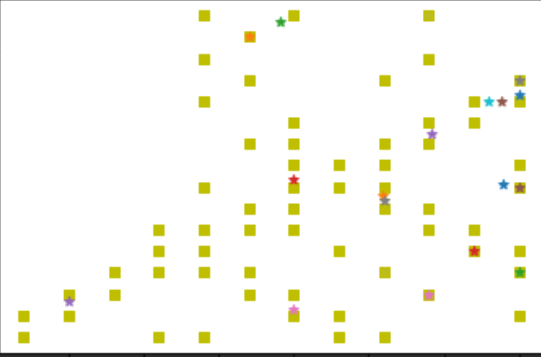
I use matplotlib to draw my results, and it looks like:

Is there any way to write them into a .vtk file and looks like a 3D graph?
In Slicer you can plot data like this:
Get a volume from SampleData and compute its histogram
import SampleData
import numpy as np
volumeNode = SampleData.SampleDataLogic().downloadMRHead()
histogram = np.histogram(arrayFromVolume(volumeNode), bins=50)
chartNode = slicer.util.plot(histogram, xColumnIndex = 1)
chartNode.SetYAxisRangeAuto(False)
chartNode.SetYAxisRange(0, 4e5)
Hope it helps
Mauro
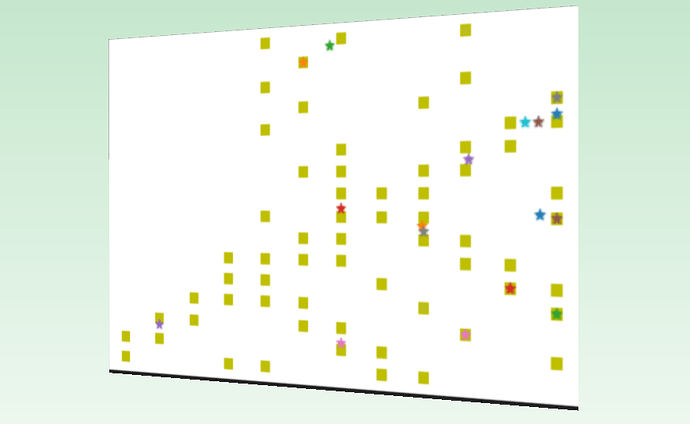
you mean something like this?
then you can use vtkImageActor class and save its input as vtk.
(code for the above):
from vedo import Picture, show
pic = Picture("https://discourse.vtk.org/uploads/default/original/2X/4/4c572287d5ce9d0efbb98ce33b3cf3aaaaf39965.png")
pic.show(bg2="green9").close()

# Another option:
# import numpy as np
# from vedo.pyplot import plot
# data = np.random.rand(200,2)
# plot(data, marker='s', mc="green5", lw=0).show()
Is there a way to remove background? And let squares and stars be like 3D objects( give them a thick)
but then you need to recreate the plot, for this you may use a vtkGlyph object.
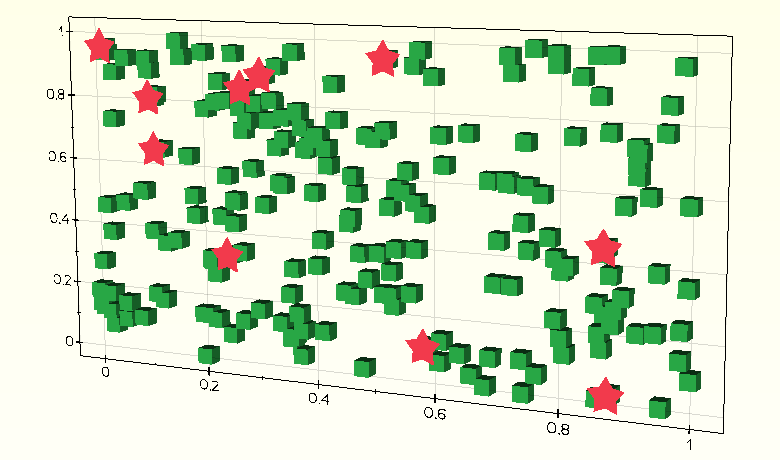
vedo has this functionality, plus you can control the plot aspect ratio:
import numpy as np
from vedo.pyplot import plot
from vedo import Cube, Star
data = np.random.rand(200,2)
m = Cube().scale(0.025)
p = plot(data, marker=m, mc="green5", lw=0, aspect=16/9)
s = Star().scale(0.03).extrude(0.1)
p+= plot(data[:10], marker=s, mc="red5", lw=0, like=p)
p.unpack(1).lighting("default")
p.show()
Thanks so much!
Btw, can I write .vtk file through matplotlib? cuz I draw images above through matplotlib, want to figure out if there’s a way to write 3D file at the same time

