Hi,
I have a number of unstructured meshes (of right ventricles) converted to PolyData on which I am attempting to identify physiologically relevant regions (septal wall, free wall, valves, etc). Based on location, curvature, and cell normals, I create a scalar array of cell data that contains integers for each region.
To check the accuracy of my approach, I’ve created a render object to take a PolyData input and write a PNG of the render. I can also write out a vtk file at the same point in the code and visualize the PolyData in Paraview. These yield inconsistent results (Paraview is correct).
Some code snippets (the render object first)
class DebugRender:
    def __init__(self):
        self.mapper = vtkPolyDataMapper()
        self.actor = vtkActor()
        self.actor.SetMapper(self.mapper)

        self.render = vtkRenderer()
        self.render.AddActor(self.actor)

        self.window = vtkRenderWindow()
        self.window.AddRenderer(self.render)
        self.window.OffScreenRenderingOn()
    def set_map_input(self, meshdata):
        self.mapper.SetInputData(meshdata)
        self.mapper.Update()
    def call_render(self):
        self.window.Render()
    def write_render(self, name):
        winfilt = vtkWindowToImageFilter()
        winfilt.SetInput(self.window)
        w = vtkPNGWriter()
        w.SetInputConnection(winfilt.GetOutputPort())
        w.SetFileName(name)
        w.Update()
        w.Write()
and the actual use of this (note g.meshdata is the polydata object and self.regions contains the values I want to visualize):
  g.meshdata.GetCellData().AddArray(self.regions)
  g.meshdata.GetCellData().SetScalars(self.regions)
  db = DebugRender()
  db.set_map_input(g.meshdata)
  db.call_render()
  db.write_render('TestOutput.png')
Again, using the debugger I also wrote out the polydata to a vtk file, and loaded it up into Paraview.
The results are:
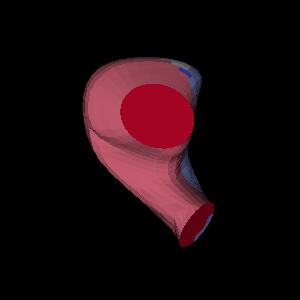
(from the render) 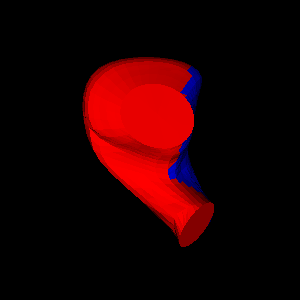
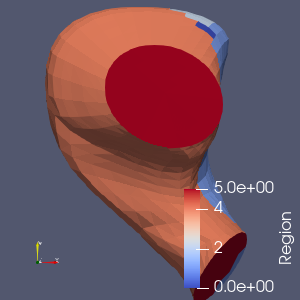
(viewed in Paraview) 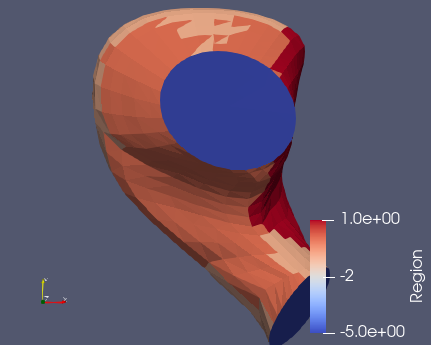
The particular problem is that the oval regions (top middle and seen from edge at bottom) are not the right color - the render colors them the same as the left side of the mesh, unlike the correct values shown in the Paraview window.