There are a lot of different ways you could resample/interpolate your sparse points onto your surface. Here are a few using numpy, scipy and vtki but you probably want to check out libraries that implement kriging.
import vtki
import numpy as np
# Load STL file
surface = vtki.read('InterpolatingOnSTL_final.stl')
# Load numpy file
foo = np.loadtxt('points.txt', skiprows=1, delimiter='\t')
lookup = vtki.PolyData(foo[:, 0:3])
lookup.point_arrays['val'] = foo[:,3]
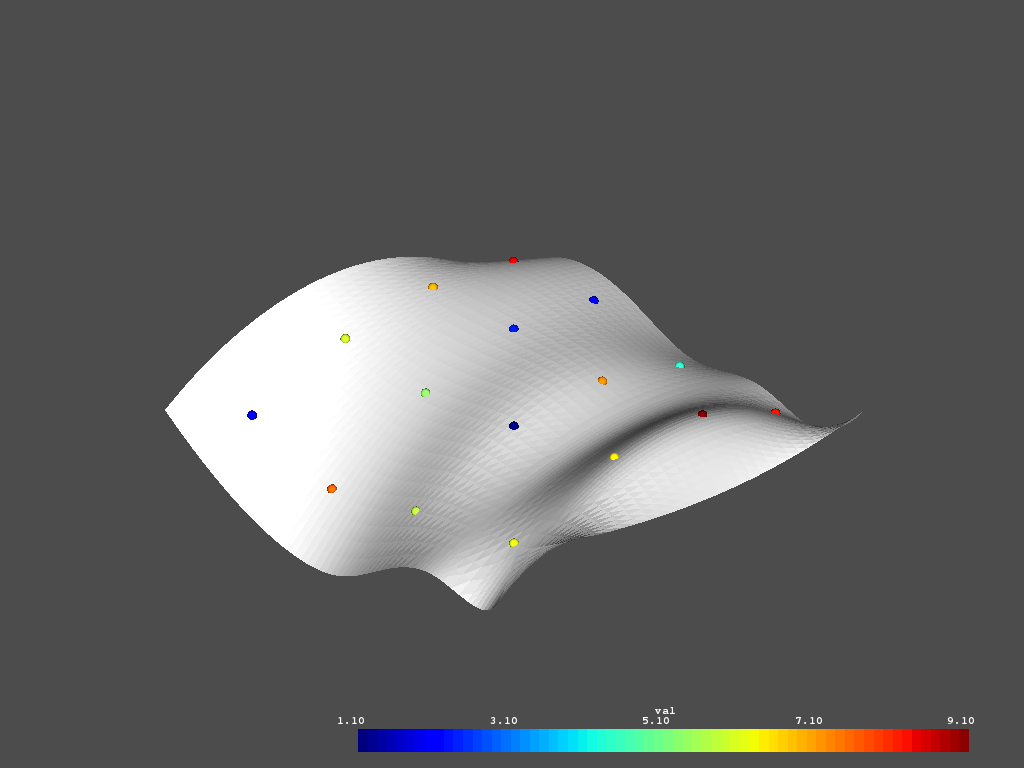
# Inspect the given data
p = vtki.Plotter()
p.add_mesh(surface)
p.add_mesh(lookup, render_points_as_spheres=True, point_size=10)
p.show()
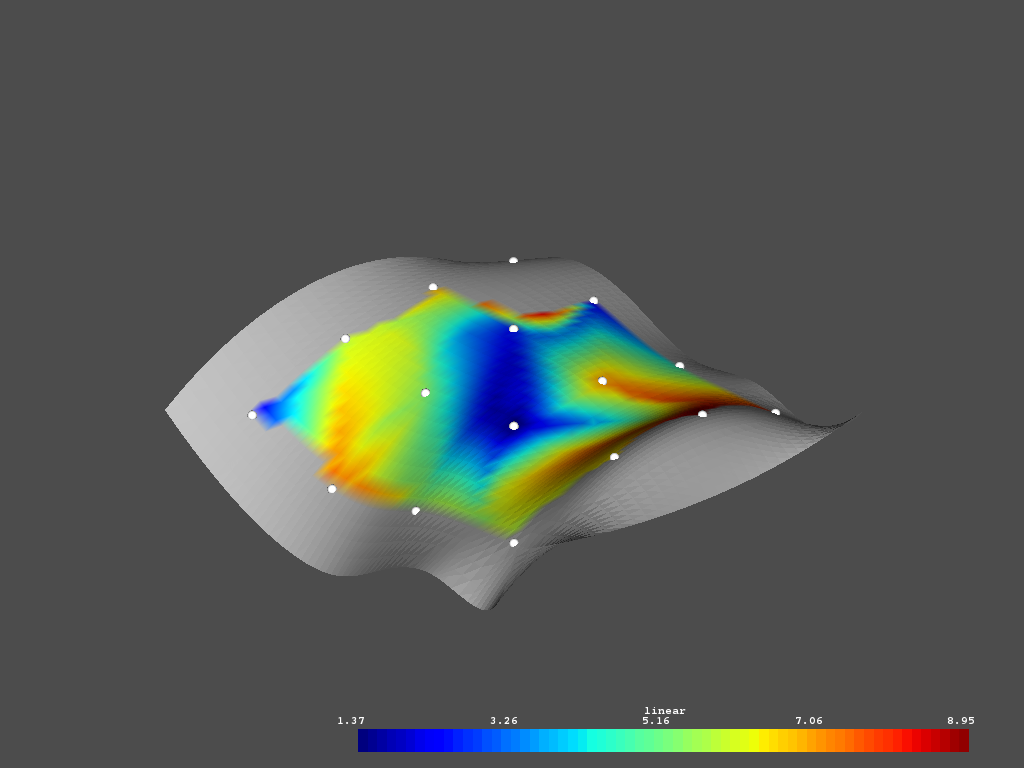
# Use scipy to run interpolation
from scipy.interpolate import griddata
method = 'linear'
surface.point_arrays[method] = griddata(
lookup.points, lookup.point_arrays['val'],
surface.points, method=method)
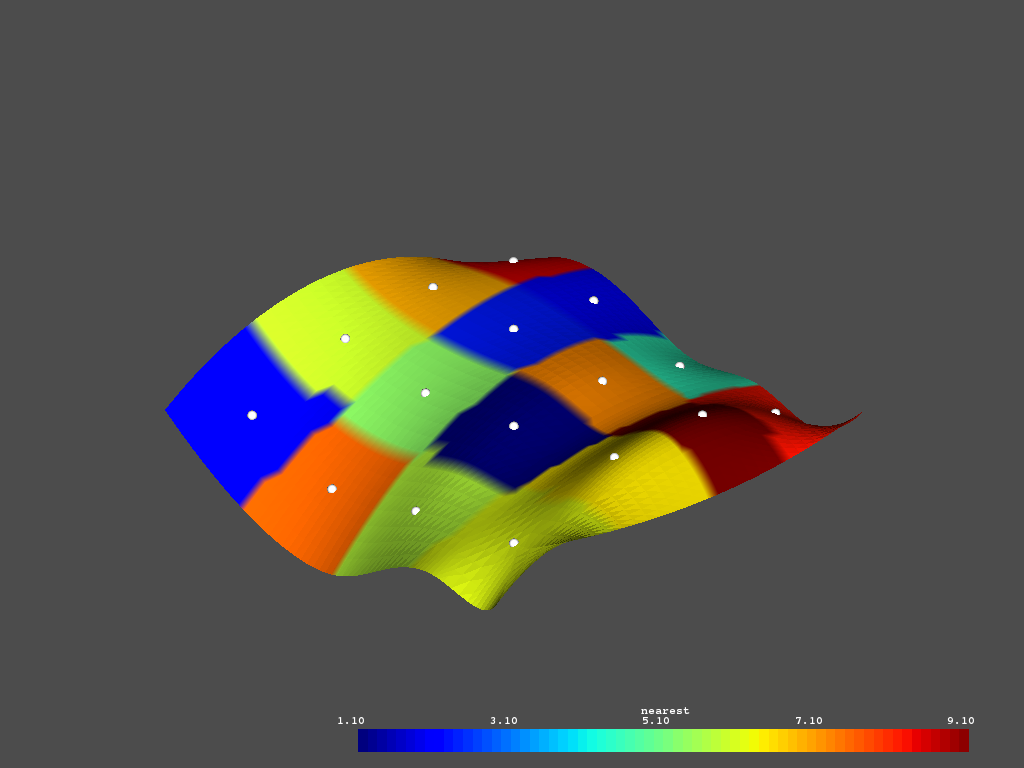
method = 'nearest'
surface.point_arrays[method] = griddata(
lookup.points, lookup.point_arrays['val'],
surface.points, method=method)
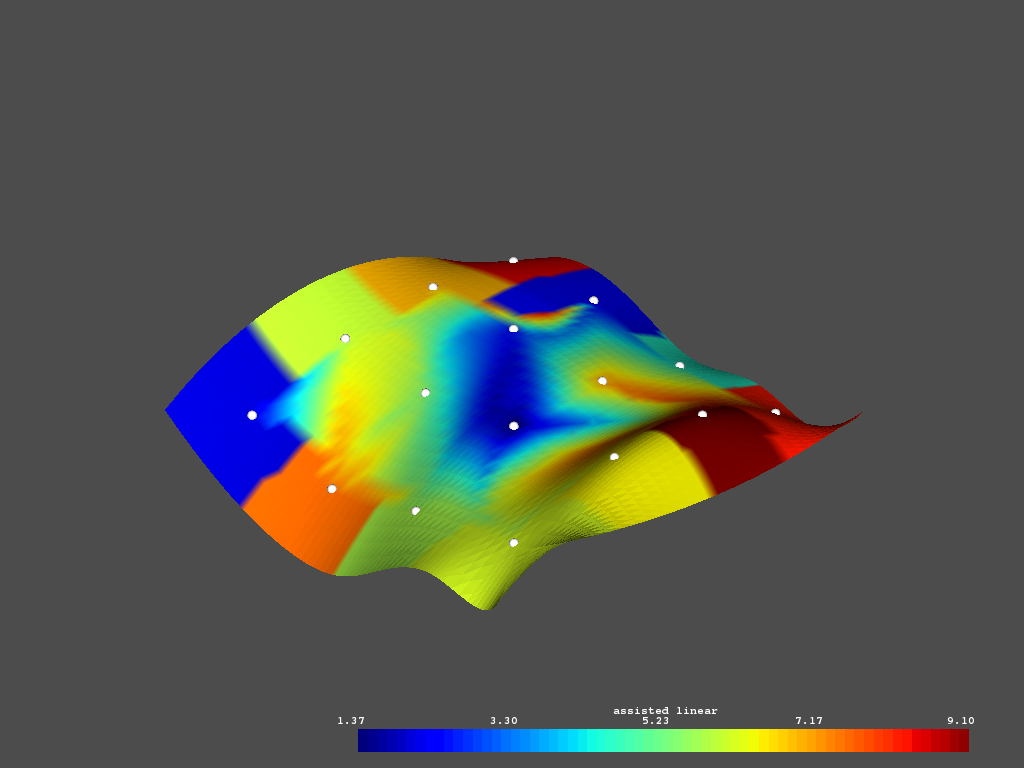
# Assisted linear
assisted = surface.point_arrays['linear'].copy()
badi = np.argwhere(np.isnan(assisted))
assisted[badi] = surface.point_arrays['nearest'][badi]
surface.point_arrays['assisted linear'] = assisted
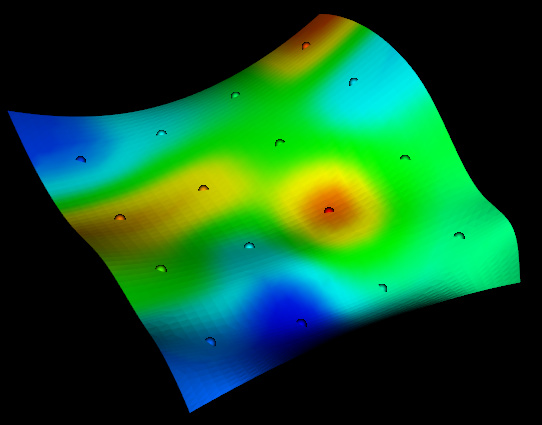
# Plot the nearest neighbor interpolated data
p = vtki.Plotter()
p.add_mesh(surface, scalars='nearest')
p.add_mesh(lookup, render_points_as_spheres=True,
           point_size=10, color='w')
p.show()
# Plot the linear interpolated data
p = vtki.Plotter()
p.add_mesh(surface, scalars='linear')
p.add_mesh(lookup, render_points_as_spheres=True,
           point_size=10, color='w')
p.show()
# Plot the assisted linear interpolated data
p = vtki.Plotter()
p.add_mesh(surface, scalars='assisted linear')
p.add_mesh(lookup, render_points_as_spheres=True,
           point_size=10, color='w')
p.show()