I am encountering what appears to be a memory leak when calling Render in a loop for a vtkRenderWindow. See the code below for a minimal example. The size of the leak varies depending on the PC, anywhere from 1 MB to 10 MB per 3000 iterations. I have tested it on 3 different PCs. When I comment out the Render line (“renwin->Render();”) there is no memory leak.
Did you find the leak by profiling/debugging or by just looking at total RAM allocated? I ask this because the later is not a reliable way to tell whether a program has an actual memory leak as modern OSes and virtual machines often have fancy memory management. The Render() function calls a lot of stuff under the hood, including the OpenGL backend and GUI API (e.g. Qt). Of course, high RAM usage may be a symptom of allocation issues, but once a suspicion is raised, one must investigate further to arrive at a conclusion.
I’ve used both. In task manager or process explorer, RAM usage continually increases until the system runs out of memory completely if I run it with sufficient iterations. And I’ve also confirmed the memory leak using tools like the Visual Studio memory profiler, MTuner, and a few others.
Edit: This appears to only be a small part of the leak…
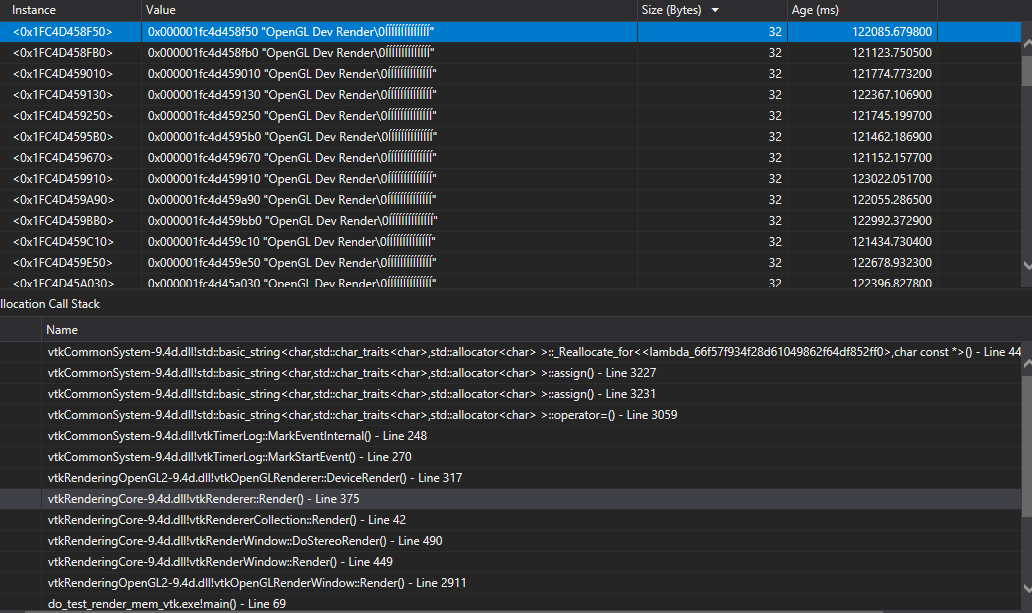
Some info from the Visual Studio profiler below. It looks like it’s happening in vtkTimerLog. My guess is the Renderer creates a timer log with text entries (e.g. “OpenGL Dev Render…”), but doesn’t cleanup this text data.
If I were the code reviewer, I’d reject it on sight.
You’re basically setting something in VTK’s bowels via a very risky low level C-style call. Please, try to set your data values via VTK API and try again.
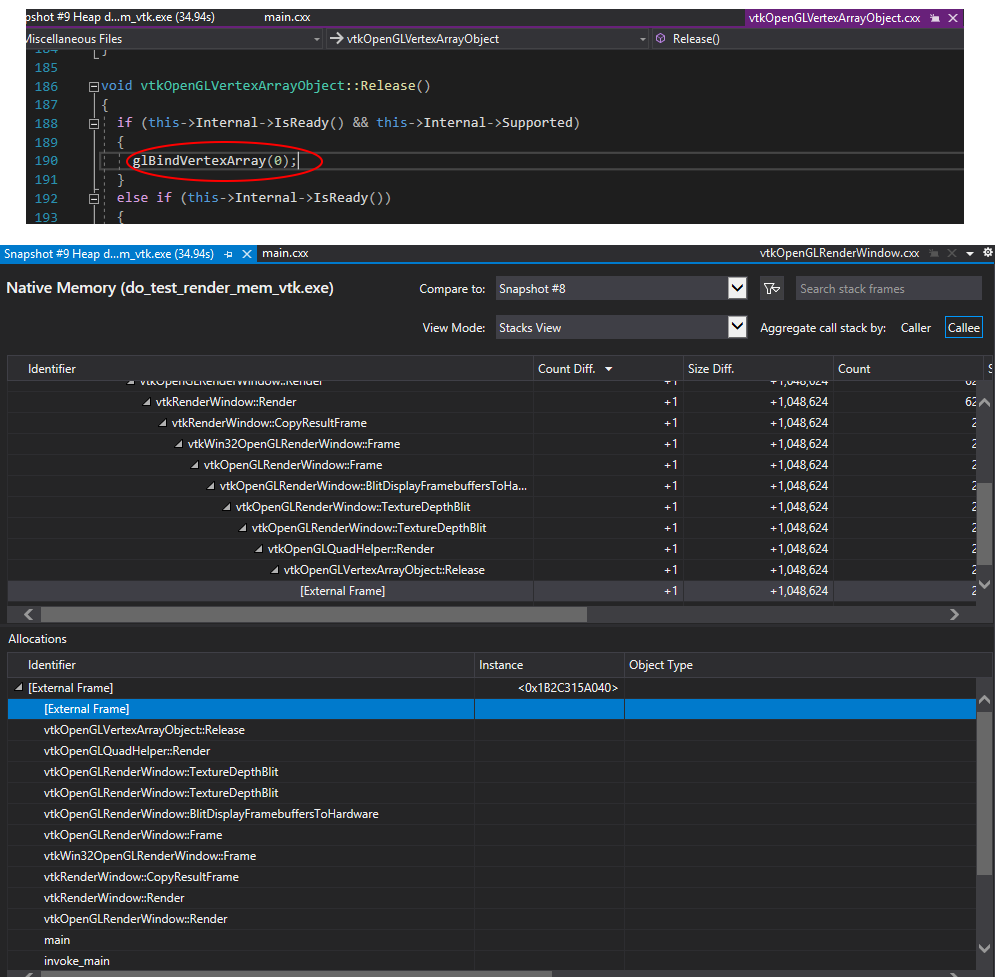
Some more info: I’ve tracked down most of the memory leak to line 190 in “vtkOpenGLVertexArrayObject.cxx” where it calls the OpenGL function “glBindVertexArray(0);” in the Release function.
That line appears to add about 1 MB to the heap once every few seconds while running the Render loop. I have no idea why, or what can be done to fix it. Any help would be appreciated!
I think the driver is caching the VAO in its implementation until the next usage. Nothing to worry about here. This is not really a memory leak because it may be clearing the cache when your application exits. The OpenGL driver is just not accustomed to this usage pattern of binding 0 since the spec says it’s not really required to bind 0 to a vertex array.
If the memory growth is really bothering you, you could try creating a new mapper per iteration of the loop and assign it to your actor.
Replacing the mapper doesn’t appear to make a difference.
Our application produces high framerate video and needs to be on for long periods of time uninterrupted, so we can’t rely on application exit to clear out the memory. The high video framerate combined with this memory leak eventually leads to the application running out of memory.
Is there perhaps a way for me to periodically request VTK to clear out any unused VAO in opengl? Or another workaround?
I believe I’ve identified the ultimate culprit: the Nvidia driver. It turns out that downgrading the driver to an older version, specifically 553.35 (from November 2024) fixes the issue. For now we can use the older driver, but this leaves us in a tricky situation as we likely won’t be able to use an older driver for long. Maybe VTK support for WebGPU will be available soon…
Perhaps you could make a branch where you code your application following the pattern of the Animation example above. It is possible that you circumvent the driver bug in case you can’t afford the time waiting for NVidia to come up with a hot fix.