Aside from array scalars, VTK currently supports point or cell scalars, which means either the scalars array needs to match the number of points or cells. I’d like to plot scalars such that each point of each cell had an assigned scalar. This is possible when each cell contains isolated points, but if cells share common points, it is impossible to assign scalars to each point of each cell.
Other than duplicating points in order to truly isolate cells within VTK, is there any way to add scalars to each point of each cell?
Hmmm… In Open Inventor we have nomething called indexed vertexes, that is: you can create two vertexes sharing the same XYZ, so you can assign different scalars without duplicating geometry. In VTK, I think your best shot is to create vtkCells of type vtkVertex. A vtkVertex is a cell wich is a single point. Of course you can create as many vtkVertexes as you like sharing the same vtkPoint.
I think @Paulo_Carvalho’s approach using the vtkVertex cell approach in a vtkUnstructuredGrid would be the best approach as far as data storage goes. However, if the mesh has any cells other than vertices (e.g. quads, triangles, tetrahedrals, etc.) then you’ll immediately run into problems with missing cell data (though I suppose you could just fill those cells with NaNs but that might turn into a whole lotta NaNs that have to be stored).
Also, I can’t really wrap my head around how you might display this kind of data… would you interpolate the values at the nodes for each 2/3D cell across the cell? Or how might you display two values at the same vertex without using some sort of geometric distortion?
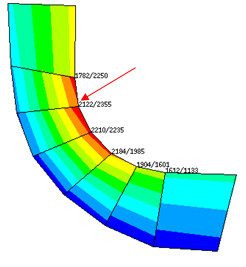
As I’m hoping to plot 3D cells, vertices won’t work in this case. As for an example of the results plot:
These are finite element stresses, which are continuous within elements but discontinuous between elements, hence why they share the same points, but different scalar data per point. The best I can come up with is representing each cell with unique, though co-located points, that way you can assign each cell with unique scalars.