Is there a way to change how points are displayed? Specifically, is it possible to add an outline to all points similar to the matplotlib figure below
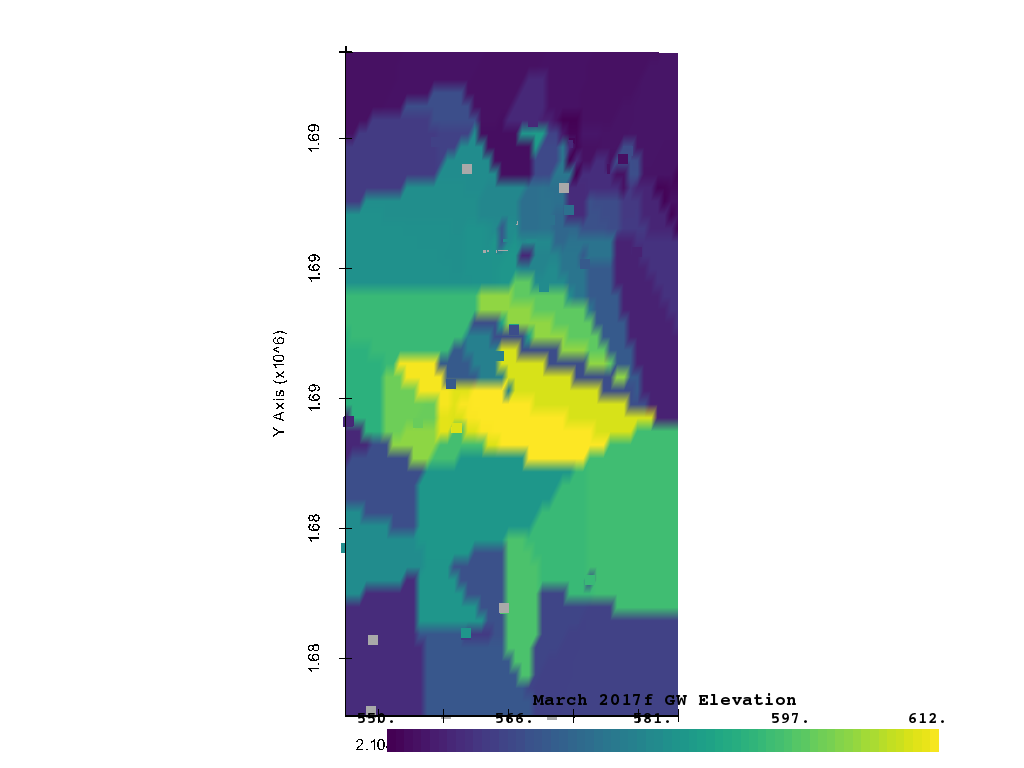
matplotlib figure of some hard data points and an interpolated grid

VTK figure of the same data (note how truth points are barely visible)
This example is in 2D, but I’d like a solution that also works in 3D