Python VTK -- Can we get the mesh rendered from the colorized point cloud

Hello,

I am going to capture different images from different viewpoint pose of virtual camera in Python VTK. When I set a close viewpoint to the point cloud, the point cloud became sparse and I could not get a good image to reflect the original color. When I set the viewpoint far from the point cloud, I could get a better image. I am wondering if there a way to first render the colorized point cloud and we can capture the image from different pose, but remain the image quality. Thanks.

shot_1 shot_2 shot_3shot_4

You could render the points as spheres with diameters large enough that there is no gap between points.

Thanks for your reply.

I try with my code but it is too slow to view all the points. I need to process at most 1 million point cloud (at least 100000) – large data sets. Any faster method for rendering the colorized point cloud (convert to sphere)? Thanks.

This is my code:

# Load the spherical model
test = BTL_GL.BTL_GL()
pcd, pc, pc_color = test.GL_NonFlat()

sphere = vtk.vtkSphereSource()
sphere.SetThetaResolution(100)
sphere.SetPhiResolution(50)
sphere.SetRadius(0.0025)
sphereMapper = vtk.vtkPolyDataMapper()
sphereMapper.SetInputConnection(sphere.GetOutputPort())
spheres = list()

N = 2000

for i in range(N):

npy_spot = np.asarray([pc[i,0], pc[i,1], pc[i,2]])
npy_color = np.asarray([pc_color[i, 0], pc_color[i, 1], pc_color[i, 2]])
spheres.append(vtk.vtkActor())
# spheres[i].SetRadius(0.05)
spheres[i].SetMapper(sphereMapper)
spheres[i].GetProperty().SetColor(npy_color[0] / 255, npy_color[1] / 255, npy_color[2] / 255)
spheres[i].AddPosition([npy_spot[0], npy_spot[1], npy_spot[2]])

ren = vtk.vtkRenderer()
renWin = vtk.vtkRenderWindow()
renWin.AddRenderer(ren)
iren = vtk.vtkRenderWindowInteractor()
iren.SetRenderWindow(renWin)

for i in range(0, N):
ren.AddActor(spheres[i])

ren.SetBackground(0.2, 0.3, 0.4)
renWin.SetSize(640, 480)
renWin.SetWindowName(“Specular Spheres”)

iren.Initialize()
renWin.Render()
iren.Start()

Yes. Adding a new sphere actor to the renderer for each point is not efficient. Instead, create only one sphere actor and map it to each point with vtkGlyph3DMapper. Something like this:

sphere = vtk.vtkSphereSource()
sphere.SetPhiResolution(5)
sphere.SetThetaResolution(5)
sphere.SetRadius(0.0025)

#add your point coordinates to the poly data... along with a field to specify the point color?
point_poly_data = vtk.vtkPolyData()

point_mapper = vtk.vtkGlyph3DMapper()
point_mapper.SetInputData(point_poly_data)
point_mapper.SetSourceConnection(sphere.GetOutputPort())
#you'll need to do something more here to map the point colors I think

actor = vtk.vtkActor()
actor.SetMapper(point_mapper)
actor.GetProperty().LightingOff()
actor.GetProperty().BackfaceCullingOn()

vtk_renderer.AddActor(actor)

Thanks for your reply. I write the code and debug for a long time but still not able to get the colorized sphere. Here is my code:

# Load the data
nc = vtk.vtkNamedColors()
test = BTL_GL.BTL_GL()
pcd, pc, pc_color = test.GL_NonFlat()

# The sphere model
sphere = vtk.vtkSphereSource()
sphere.SetPhiResolution(5)
sphere.SetThetaResolution(5)
sphere.SetRadius(0.0025 * 2)

Points = vtk.vtkPoints()

Colors = vtk.vtkUnsignedCharArray()
Colors.SetNumberOfComponents(3)
Colors.SetName(“Colors”)
Colors.InsertNextTuple3(255,0,0)

for i in range(len(pc)):
Points.InsertNextPoint(pc[i, 0], pc[i, 1], pc[i, 2])
Colors.InsertNextTuple3(pc_color[i, 0] / 255, pc_color[i, 1] / 255, pc_color[i, 2] / 255)

polydata = vtk.vtkPolyData()
polydata.SetPoints(Points)
sphere.GetOutput().GetCellData().SetScalars(Colors)
sphere.Update()

appendData = vtk.vtkAppendPolyData()
appendData.AddInputConnection(sphere.GetOutputPort())
appendData.Update()

point_mapper = vtk.vtkGlyph3DMapper()
point_mapper.SetInputData(polydata)
point_mapper.SetSourceConnection(appendData.GetOutputPort())

# Set background color
actor = vtk.vtkActor()
actor.SetMapper(point_mapper)
actor.GetProperty().LightingOff()
actor.GetProperty().BackfaceCullingOn()

ren = vtk.vtkRenderer()
ren.SetBackground(.2, .3, .4)
ren.AddActor(actor)

renWin = vtk.vtkRenderWindow()
renWin.AddRenderer(ren)

# Interactor
renderWindowInteractor = vtk.vtkRenderWindowInteractor()
renderWindowInteractor.SetRenderWindow(renWin)

# Begin Interaction
renWin.Render()
renderWindowInteractor.Start()

I see 3 possibilities:

  1. use actor.GetProperty().RenderPointsAsSpheresOn() somewhere in your code.
  2. this works for me, using vtkVertexGlyphFilter :
import vtk

# Load the data for point cloud and colorized vectors
# nc = vtk.vtkNamedColors()
# test = BTL_GL.BTL_GL()
# pcd, pc, pc_color, MeshGrid, img_color = test.GL_NonFlat()
n = 10
src = vtk.vtkPointSource()
src.SetNumberOfPoints(n)
src.Update()

vgf = vtk.vtkVertexGlyphFilter()
vgf.SetInputData(src.GetOutput())
vgf.Update()
pcd = vgf.GetOutput()

ucols = vtk.vtkUnsignedCharArray()
ucols.SetNumberOfComponents(3)
ucols.SetName("Colors")
for i in range(n):
    ucols.InsertNextTuple3(255,i*30,i*30)
pcd.GetPointData().SetScalars(ucols)


# Design the mapper
point_mapper = vtk.vtkPolyDataMapper()
point_mapper.SetInputData(pcd)

actor = vtk.vtkActor()
actor.SetMapper(point_mapper)
actor.GetProperty().SetPointSize(10)
actor.GetProperty().RenderPointsAsSpheresOn()

ren = vtk.vtkRenderer()
ren.SetBackground(.2, .3, .4)
ren.AddActor(actor)

renWin = vtk.vtkRenderWindow()
renWin.AddRenderer(ren)

# Interactor
renderWindowInteractor = vtk.vtkRenderWindowInteractor()
renderWindowInteractor.SetRenderWindow(renWin)

# Begin Interaction
renWin.Render()
renderWindowInteractor.Start()

cols

  1. use example in https://github.com/marcomusy/vtkplotter/blob/master/examples/basic/manyspheres.py

Great appreciate the examples. I think the code is working so far but some small problems still exist such as

  1. Point distance is large in some region (we can still see some wide space between points in the edge). For some dense point cloud, this problem is more obvious and I am thinking another method to first reconstruct the point cloud surface and assign the color. But it seems not working well, as shown in fig. 1.
  2. I try with generating with the mesh with point index and triangular mesh, but it seems not working well and I am not sure if this is the problem that I didn’t change the property of the mesh, as shown in fig. 2.
  3. When we get close to the object, we can see the artifacts on the dense mesh grid. I am thinking maybe using OpenGL texture mapping might be another possible solution?
  4. I am thinking about using stl and look up table to assign the color vector to the points.

Any improvements are welcomed. Thanks again.

I have finished the code:


9

# Load the data object
‘’’
pcd: object of pcd
pc: point coordinates, M x 3
pc_color: color vectors, M x 3
img_color: color image for textured mapping
‘’’

test = BTL_GL.BTL_GL()
pcd, pc, pc_color, MeshGrid, img_color = test.GL_NonFlat()

# Define the points polydata
points = vtk.vtkPoints()
for i in range(len(pc)):
points.InsertNextPoint(pc[i, 0], pc[i, 1], pc[i, 2])
polydata = vtk.vtkPolyData()
polydata.SetPoints(points)

# Define the color to the polydata
colors = vtk.vtkUnsignedCharArray()
colors.SetNumberOfComponents(3)
colors.SetNumberOfTuples(polydata.GetNumberOfPoints())
for i in range(len(pc_color)):
colors.InsertTuple3(i, pc_color[i, 0], pc_color[i, 1], pc_color[i, 2])

# Connect the point object to the color object
polydata.GetPointData().SetScalars(colors)

# Define the VertexGlyphFilter
vgf = vtk.vtkVertexGlyphFilter()
vgf.SetInputData(polydata)
vgf.Update()
pcd = vgf.GetOutput()

# Define the mapper
point_mapper = vtk.vtkPolyDataMapper()
point_mapper.SetInputData(pcd)

# Define the actor
actor = vtk.vtkActor()
actor.SetMapper(point_mapper)
actor.GetProperty().SetPointSize(10)
actor.GetProperty().RenderPointsAsSpheresOn()

ren = vtk.vtkRenderer()
ren.SetBackground(.2, .3, .4)
ren.AddActor(actor)

renWin = vtk.vtkRenderWindow()
renWin.AddRenderer(ren)

# Interactor
renderWindowInteractor = vtk.vtkRenderWindowInteractor()
renderWindowInteractor.SetRenderWindow(renWin)

# Begin Interaction
renWin.Render()
renderWindowInteractor.Start()

What about simply triangulating your mesh? Be sure your projection plane makes sense before applying the triangulation filter.

Also, can you share these files?

Yes sure, I have an algorithm working but not the best solution. The whole work flow is shown in the following steps:

  1. Read a stl file (.stl) as a 3D model, called model A
  2. Read a image file (.png or .jpg)
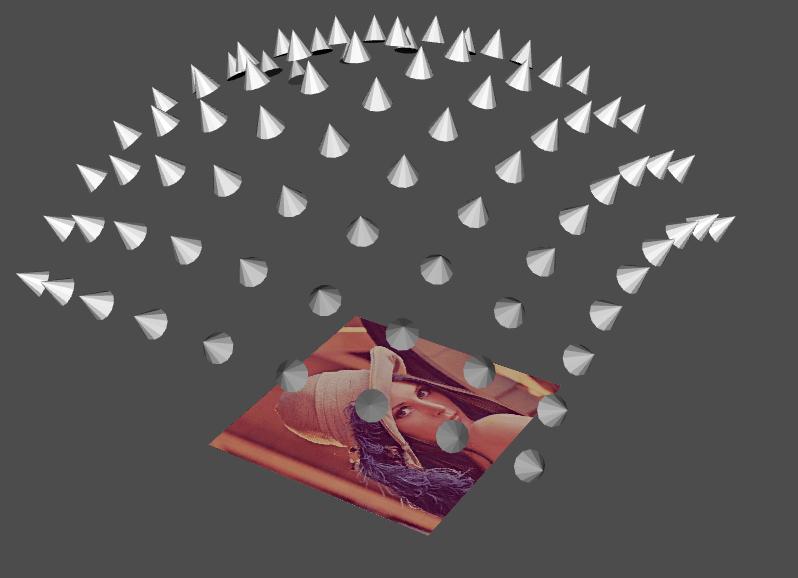
  3. According to the image size and the shape of the stl file, create a meshgrid for color interpolation. Thus we create a 3D model with color textured, called model B.
  4. For each point in the model A, assign the color vector to this point in the meshgrid with the “nearest” point found in the model B.
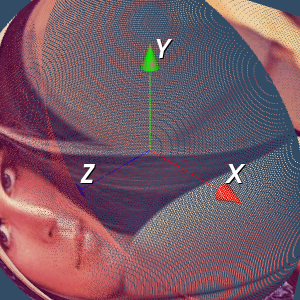
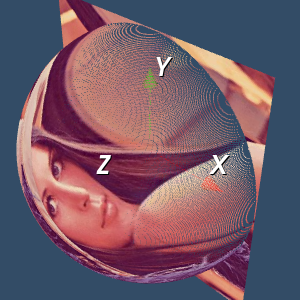
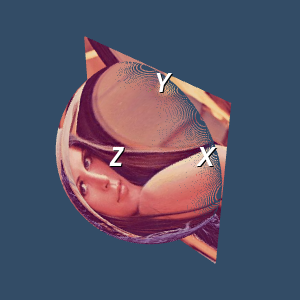
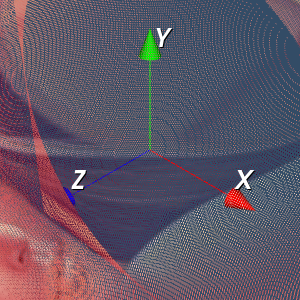
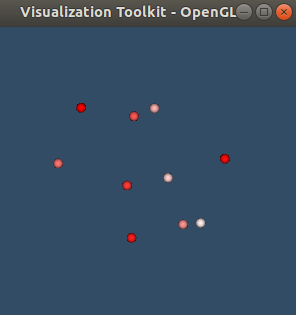
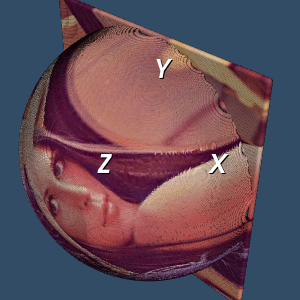
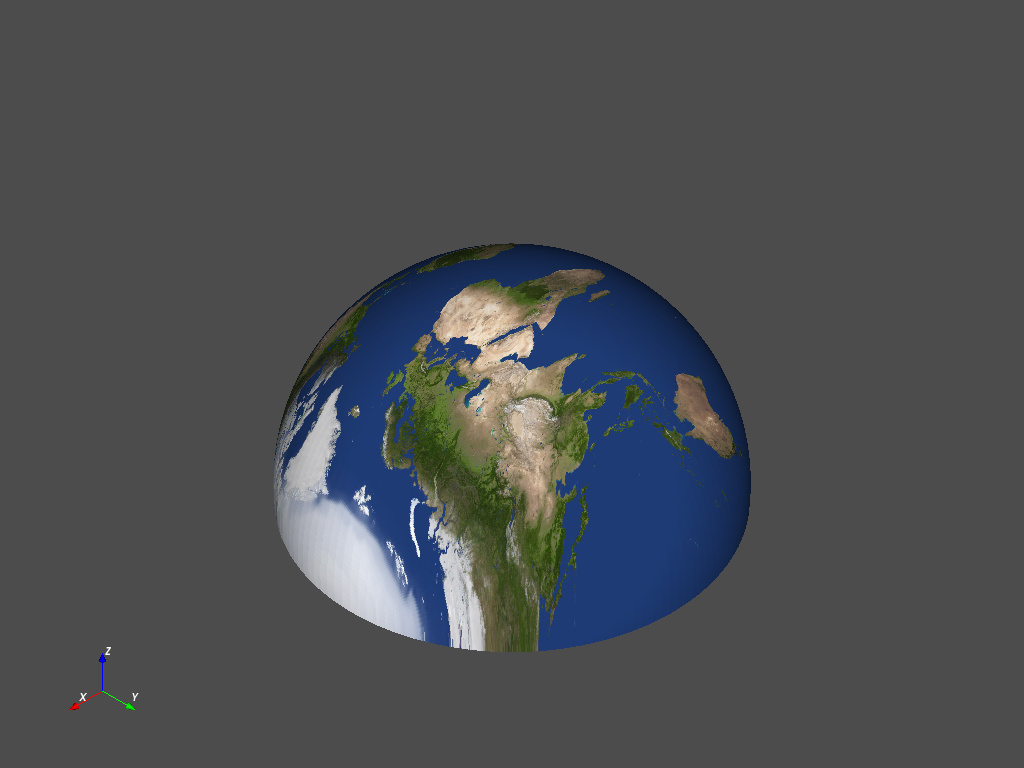
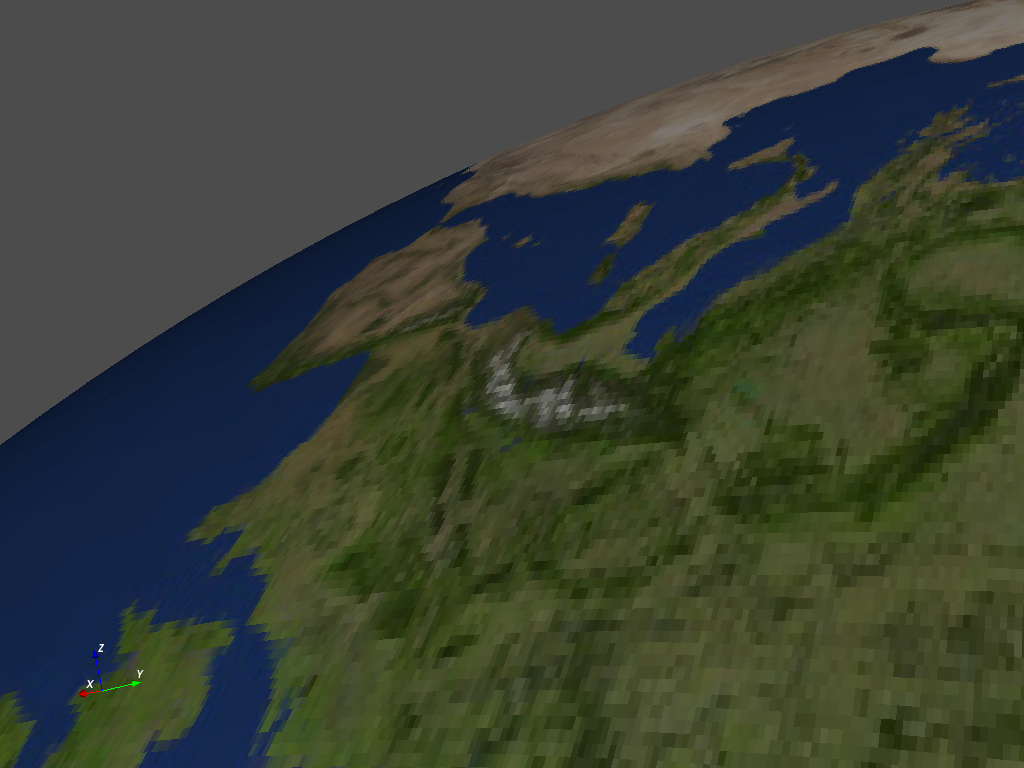
  5. Use look up table for stl color visualization.

Note: I am not allowed to attach files so I upload with the google drive link (.stl files and color.npy):
https://drive.google.com/drive/folders/1Qa9kysHJPxWXejoeTUjJYQW5-hI0vDSO?usp=sharing

The code is shown in the following. It is a little bit complicated so I only show the main function here, attached with the necessary .npy files:

# Show the colorized stl file
# Generate the stl model – we need to first know the color vector of the objects
f = vtk.vtkSTLReader()
f.SetFileName(self.stl_path) // here, use the path of the .stl file, attached with this link
f.Update()

# Update the frame rate
obj = f.GetOutputDataObject(0)
min_z, max_z = obj.GetBounds()[4:]

lut = vtk.vtkLookupTable()
lut.SetTableRange(min_z, max_z)
lut.Build()

heights = vtk.vtkDoubleArray()
heights.SetName(“Z_Value”)

# Load the color object
Colors = vtk.vtkUnsignedCharArray()
Colors.SetNumberOfComponents(3)
Colors.SetName(“Colors”)

# Load the color stl file (N x 3 vector)
COLOR = np.load(self.colorstl_file) // here, use the path of the color.npy file, attached with this link

for i in range(obj.GetNumberOfPoints()):
z = obj.GetPoint(i)[-1]
Colors.InsertNextTuple3(COLOR[i, 0], COLOR[i, 1], COLOR[i, 2])

obj.GetPointData().SetScalars(Colors)

mapper = vtk.vtkPolyDataMapper()
mapper.SetInputDataObject(obj)
mapper.SetScalarRange(min_z, max_z)
mapper.SetLookupTable(lut)

actor = vtk.vtkActor()
actor.SetMapper(mapper)

renderer = vtk.vtkRenderer()
renderer.AddActor(actor)
renderer.SetBackground(.1, .2, .4)

renw = vtk.vtkRenderWindow()
renw.AddRenderer(renderer)

iren = vtk.vtkRenderWindowInteractor()
iren.SetRenderWindow(renw)

renw.Render()
iren.Start()

I am still looking for a better way to do that. There are several problems:

  1. image resolution attached with the triangulation mesh in the stl file
  2. I am still figuring out a way to use triangulation filter.

Can you give me the original image (the PNG or JPEG)?

Yes sure. It is uploaded on the google link. It is a regular .jpg lena image with dimension as 458x447x3.

lena

You ought to try texture mapping rather than giving every point an RGB value. Also, VTK in python is streamlined with the vtki Python package (pip install vtki):

Try this:

import vtki
import numpy as np
from vtki import examples

# Load a dummy texture
texture = examples.load_globe_texture()
# or load your own texture
# texture = vtki.read_texture('image.jpeg')

# Update the frame rate
obj = vtki.read('hemis_150.stl')
# Texture map to the best fitting plane
obj.texture_map_to_plane(inplace=True)

obj.plot(texture=texture, screenshot='image.png')

As an aside to the main discussion here, I suggest looking up the controversy over using the Lena image for examples. In the interests of having a community welcoming to all, I suggest using a different example image in this forum.

1 Like

Great thanks for your reply. I am wondering if we can automatically capture the screen shots based on different camera angles. Since we are using vtki and vtk, it is easy to obtain different camera position in vtk but it might be difficult in vtki. I am wondering if there a more convenient way to obtain the data object stored in vtki object, such as vtkpoly data, etc, and use it with the vtk objects. I tried with my code but it is not getting any results:

    texture = vtki.load_texture(img_path)
    obj = vtki.read(stl_path)
    obj.texture_map_to_plane(inplace=True)
    # obj.plot(texture = texture, screenshot='image.png')

    Mapper = vtk.vtkPolyDataMapper()
    Mapper.SetInputData(obj)
    Actor = vtk.vtkActor()
    Actor.SetMapper(Mapper)

    renderer = vtk.vtkRenderer()
    renderer.AddActor(Actor)
    renWin = vtk.vtkRenderWindow()
    renWin.AddRenderer(renderer)

    iren = vtk.vtkRenderWindowInteractor()
    iren.SetRenderWindow(renWin)

    renWin.Render()
    iren.Start()

It’s quite easy. The camera position can be accessed and changed when plotting in vtki under the camera_position attribute of the plotter. Also, there are several convenience functions to view common perspectives (e.g. .view_xy()). Perhaps you’d benefit from some of the examples in the docs like this one. vtki also has a powerful background plotter that has a GUI for saving/loading camera positions.

vtki data objects are subclasses of VTK data objects so any vtki data object will work seamlessly with VTK as we only provide a wrapping on top of the VTK data object. This wrapping doesn’t alter or convert the data, it simply provides numpy array access and convenience functions to get information from the dataset. There’s no need to “obtain the data object” as the vtki objects are instances of VTK data objects and can be treated as such.

Could you be more specific? The code you show should run and produce a visualization without error. If you’d like to apply the texture, you’ll have to do a bit more if using VTK for the rendering… try passing the texture you loaded to the actor: Actor.SetTexture(texture) and Mapper.SetScalarModeToUsePointFieldData()

Thank you so much for your help. I finished the code and the function works well.

# Get the camera coordinate in the spherical model – this is important
angle_Azimuth = x_mesh[i]
angle_Elevation = y_mesh[j]
camera = vtk.vtkCamera()
camera.SetPosition(50, 50, 150) # We define the x as the radius to the spherical model – this is im
camera.SetFocalPoint(50, 50, 0)
camera.Azimuth(angle_Azimuth) # 0 to 45 with 5 as uniform sample
camera.Elevation(angle_Elevation) # 0 to 45 with 5 as uniform sample
camera.Roll(0) # no rolling in consideration – this is im
cam_coordinate = camera.GetPosition()
print("The camera coordinate is ", cam_coordinate)

focal_coordinate = (50.0, 50.0, 1.0)
plotter.camera_position = [cam_coordinate, focal_coordinate, (0.0, 1.0, 0.0)]
cam = plotter.camera_position

# Define the camera model – this is important
p_center = cam_coordinate
p_direction = np.asarray(cam_coordinate) - np.asarray(focal_coordinate)
p_scale = (1, 1, 1)
camActor = actor_camera(p_center, p_direction, p_scale)

# plotter.add_actor(camActor)
img_path = ‘creenshot/’ + str(angle_Azimuth) + ‘_’ + str(angle_Elevation) + ‘.png’
plotter.screenshot(img_path)

how to make STL ASCII from x y z volume co-ordinates ?

Please open your own topic.

1 Like