Hi all.
I have a question about the properties of the vtkChartXY.
Question1)
I want to change the color of the axis’s label.
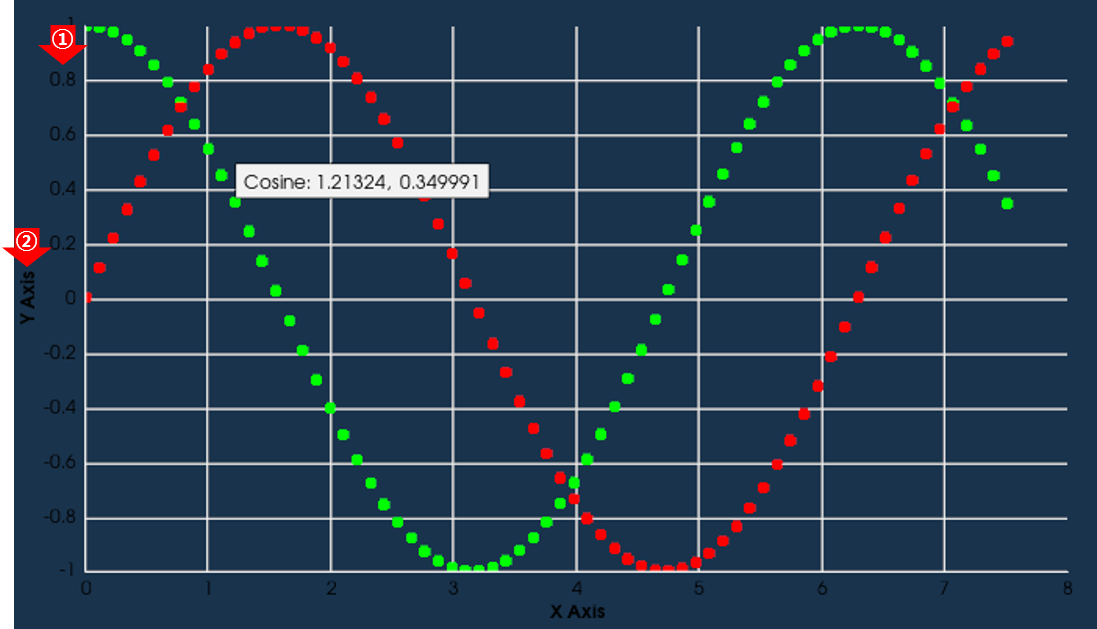
I think the ① is the ‘label’, and ② is the ‘title’.
So, I tried to test the code as below:
vtkSmartPointer<vtkChartXY> chart =
	vtkSmartPointer<vtkChartXY>::New();

vtkAxis* axis = chart->GetAxis(vtkAxis::LEFT);
axis->GetPen()->SetColor(255, 255, 255, 255);
axis->SetTicksVisible(false);
axis->GetLabelProperties()->SetColor(255, 0, 0);
axis->GetTitleProperties()->SetColor(255, 0, 0);
But there is nothing the change.
Question2)
How to change the size of the points?
I tried to the code as below:
vtkPlot *points = chart->AddPlot(vtkChart::POINTS);
points->SetInputData(table, 0, 1);
points->SetColor(0, 255, 0, 255);
points->SetWidth(0.1);
points = chart->AddPlot(vtkChart::POINTS);
points->SetInputData(table, 0, 2);
points->SetColor(255, 0, 0, 255);
points->SetWidth(0.1);
But it also nothing change.
Could you please advise for me?
Thank you 