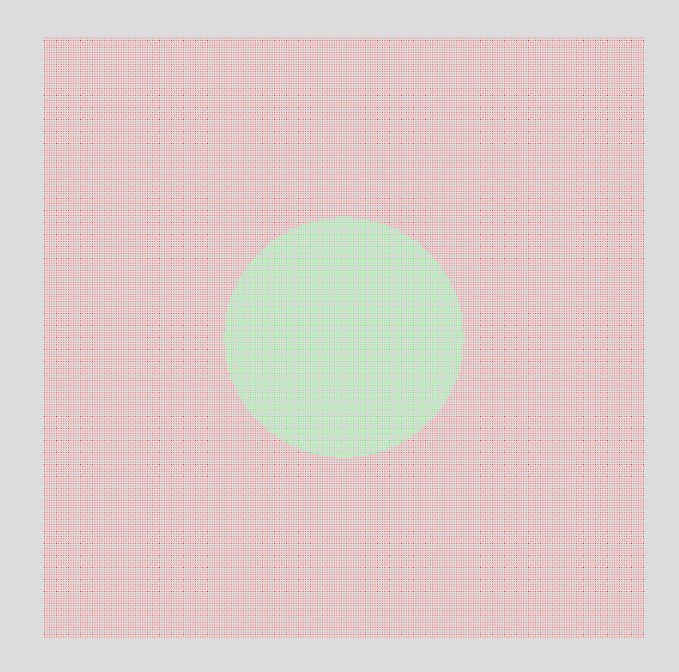
I have a vtkPolydata with 3D coordinates of the vertex of the grid as points and Temperature at each point stored as point field data. I want to plot the Temperature distribution at different elevations. I am using Python for the operation. I have created a pipeline, and I am able to get the required slice from the vtkPolydata. However, when I rendered it, the plot looked like a scatter plot as shown below:
I want to plot it without any white space in between even when zoomed in. Please help me with this. I think I have to interpolate or create contours from the data, but I have no idea how to do it even after searching for a couple of days.
The code I used to generate the plot is given below.
The vtkPolydata I used to generate the above plot can be downloaded from here: vtkPolydata
import vtk
from vtk.util import numpy_support
import numpy as np

# Load vtkPolydata function
def loadvtp(fname):
    reader = vtk.vtkXMLPolyDataReader()
    reader.SetFileName(fname)
    reader.Update()
    data=reader.GetOutput()
    return data

# Load vtkPolydata
polydata=loadvtp("TestPolydata.vtp")

# Set the elevation at which data need to be plotted
ele=12

# %% Clip polydata based on the elevation
# Create plane in +Z to cut the polydata below elevation
plane = vtk.vtkPlane()
plane.SetOrigin(0, 0, ele)
plane.SetNormal(0, 0, 1)

# create polydata clipper
clipper = vtk.vtkClipPolyData()
clipper.SetInputData(polydata)
clipper.SetClipFunction(plane)
clipper.Update()

out_data=clipper.GetOutput()

# Create plane in -Z to cut the polydata above elevation
plane = vtk.vtkPlane()
plane.SetOrigin(0, 0, ele+0.5)
plane.SetNormal(0, 0, -1)
clipper = vtk.vtkClipPolyData()
clipper.SetInputData(out_data)
clipper.SetClipFunction(plane)
clipper.Update()

# Cliped polydata
sampled_data=clipper.GetOutput()

# Get the "Temperature" Array from the polydata
point_scalars = sampled_data.GetPointData().GetArray("Temperature")

# Create a lookup table to map the point field data to colors
lut = vtk.vtkLookupTable()
lut.SetNumberOfTableValues(2)
lut.SetTableValue(0, 1, 0, 0, 1) # red
lut.SetTableValue(1, 0, 1, 0, 1) # green
lut.Build()

# Create a mapper and actor to display the cliped plane
mapper = vtk.vtkPolyDataMapper()
mapper.SetInputConnection(clipper.GetOutputPort())
mapper.SetScalarModeToUsePointFieldData()
mapper.ScalarVisibilityOn()
mapper.SetColorModeToMapScalars()
mapper.SelectColorArray(0)
mapper.SetLookupTable(lut)
mapper.SetScalarRange(point_scalars.GetRange())

actor = vtk.vtkActor()
actor.SetMapper(mapper)

# Create the RenderWindow, Renderer
colors = vtk.vtkNamedColors()

ren1 = vtk.vtkRenderer()
renWin = vtk.vtkRenderWindow()
renWin.AddRenderer(ren1)
iren = vtk.vtkRenderWindowInteractor()
iren.SetRenderWindow(renWin)

ren1.AddActor(actor)

ren1.SetBackground(colors.GetColor3d('Gainsboro'))
renWin.SetSize(650, 650)
renWin.SetWindowName('Test')

style = vtk.vtkInteractorStyleTrackballCamera()
iren.SetInteractorStyle(style)

ren1.TwoSidedLightingOff()

ren1.ResetCamera()

renWin.Render()
iren.Start()
