I was wondering if anyone would be able to help me.
I have a series of different point clouds (.ply files) of different fields containing crop plots. I’ve generated this using Pix4D. These field have a natural slope to them which shows in the point cloud elevation.
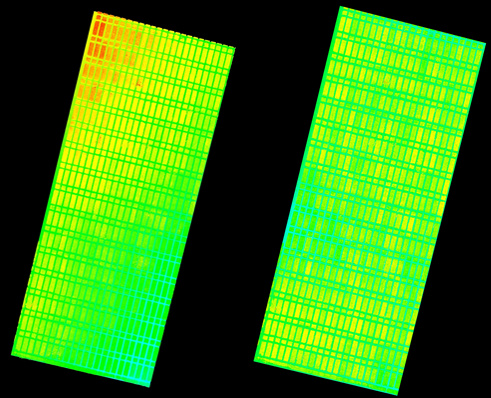
I have utilized the code in this SO question, https://stackoverflow.com/questions/52716438/python-vtk-normalize-a-point-cloud, to level/ flatten these to an extent to get everything roughly on the same plane. As demonstrated in the attached image, I used the vtk elevation filter to colour the clouds.
My next step in my work, which I have been struggling to achieve for some time now, is being able to extract the height for individual plots. My thoughts were that I could somehow remove the ground level from the point cloud and then I can work on the distance between the lowest and highest points for each individual plot.
Can anyone provide any advice on what the best way might be to achieve this segmentation of the plots?
Also if anyone thinks that there is a better way of “levelling” my clouds to be on the same plane I would be interested in trialling other methods.
First, I’m going to solicit that you check out vtki as it makes working with VTK in python a bit more convenient/intuitive. For example, that stack overflow code could be replaced with:
import vtki
import numpy as np

filename = 'File.ply'
# Read
data = vtki.read(filename)
# Elevation filter
evgf = data.elevation() # defaults are min/max Z bounds
# And render it
evgf.plot()
vtki also provides a more direct numpy interface to your VTK data object so you could manipulate your points a bit easier.
I’m still a bit confused about what you want to do… can you elaborate more on what exactly you are trying to do?
Is each “plot” one of the many small rectangles in the point clouds? From what I understand, you’re going to have to use some sort of pattern recognition to identify the plots… but even if you do this, what exactly do you want to know about each plot?
Thank you for your response. I will definitely look into implementing vtki, seems a much nicer/ easier way of using VTK in python.
With regards to your question; the individual “plots” are indeed the individual small rectangles. The information I want to know for each each plot will be the lowest and highest points.
This is indeed a challenging problem. I’m not sure that you could do this in pure VTK… my approach would be:
Use a pattern recognition algorithm to find and label the plots individually.
Possibly a convolutional neural network? … you would have to manually create a few labeled features. Shouldn’t be too cumbersome with this small of a dataset since the pattern is super uniform.
Once you have the plots segmented, label them uniquely by clustering.
Find the highest/lowest Z values for each labeled plot
All of this can be done using Python and libraries like sci-kit learn and TensorFlow. I’d start with just the XYZ values of the plots and go from there.
I imagined that I wouldn’t be able to do it purely in VTK but thought it worth asking in case someone knew a way that I was missing. It’s good to confirm though.
I appreciate the advice and I will start looking into implementing a pattern recognition algorithm. I have a colleague who knows CNNs well so will get some pointers from him.
I’ve only really just been able to start playing around with vtki and just had a quick question regarding the plotting of point clouds.
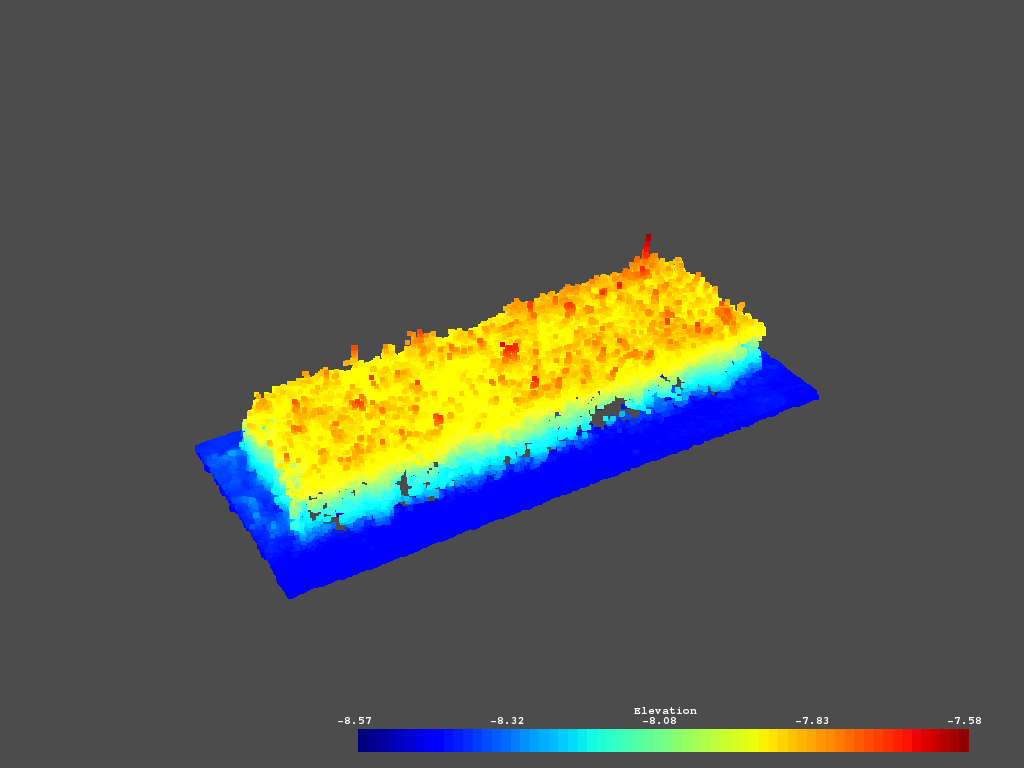
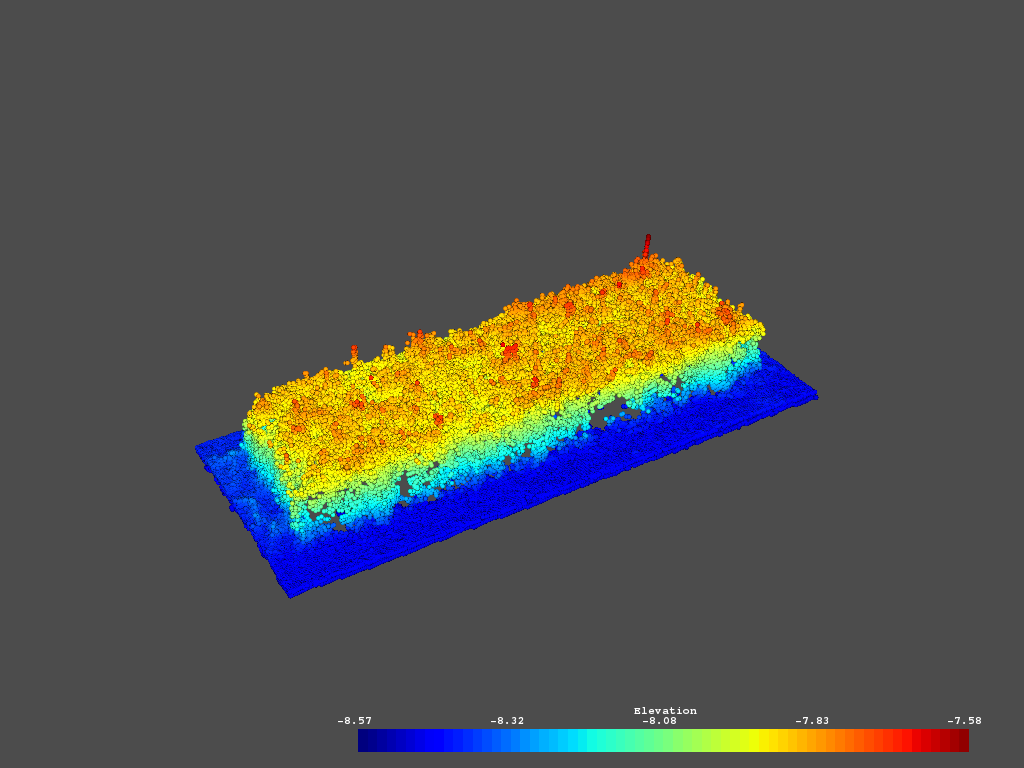
When I have tried to plot, as you suggested in your first response, I just get a grey background and a scalar bar but nothing else. In VTK to visualize point clouds the only solution I have been able to find requires applying the vtkVertexGlyphFilter first and then applying the elevation filter before plotting.
If I wanted to use vtki, what would be the correct way to use the VertexGlyphFilter in order to visualize the point cloud? I could not find anything when I scanned/ searched the documentation.
The data is a .ply point cloud that I generated using Pix4D. Normally I read it in using the vtkPLYReader and plot with the vtkPolyDataMapper. So going off the VTK docs I’d say it is PolyData/ AbstractPolyData?
I’ve included a clipped down version of the point cloud (just one crop plot), hopefully you can access it. I thought a smaller version would be easier and quicker than sharing the full set of data. (Also there is a file size limit)
@jball, something isn’t right with the format of that PLY file… the vertices are not being properly defined. To mitigate this, simply load and cast:
import vtki
import numpy as np

filename = '/Users/bane/Downloads/Test_point_cloud.ply'
# Read the improperly formatted PLY file
foo = vtki.read(filename)
# Grab points from bad data structure and use those point to construct PolyData correctly
pc = vtki.PolyData(foo.points)
# Elevation filter
evgf = pc.elevation() # defaults are min/max Z bounds
# And render it
evgf.plot()
Now that the vertice cells are properly defined, there’s no need for a glyph filter. However, if you like glyphing, vtki has code for that! Check out this example.
That’s great thank you very much for the help! Odd that the PLY file format isn’t quite right… I will have to do some research into it. It may be something in the way that the Pix4DMapper software creates the cloud.
Thank you again for the swift response. vtki is definitely something that I am keen to use as it seems to make things a little easier, scripting wise.