Hey guys, I’m just having some difficulties moving over from pyvista to pure VTK (so that I can eventually move into c++). What I’ve been attempting is rendering a grid of points with associated scalar values as a series of transparent isosurfaces. Illustrated below.

And I’ve managed to do this in Pyvista with just a few LOC
X, Y, Z = np.meshgrid(x0range, y0range, z0range, indexing='ij')
mesh = pv.StructuredGrid(X, Y, Z)
mesh.point_data['values'] = data.ravel(order='F')
pl = pv.Plotter()
pl.add_mesh(mesh.outline(), color="k")
pl.add_mesh(mesh.contour(isosurfaces=np.linspace(1000, 10000, 10)), opacity=0.5, clim=[1000, 10000])
pl.show_bounds(grid='back', location='outer', ticks='inside', zlabel='level', bold=False, font_size=12.0)
pl.show()
Now I’m looking at converting that over into pure VTK and I’ve got something mostly working using a vtkImageData instance and a vtkContourFilter, as well as a vtkCubeAxesActor.
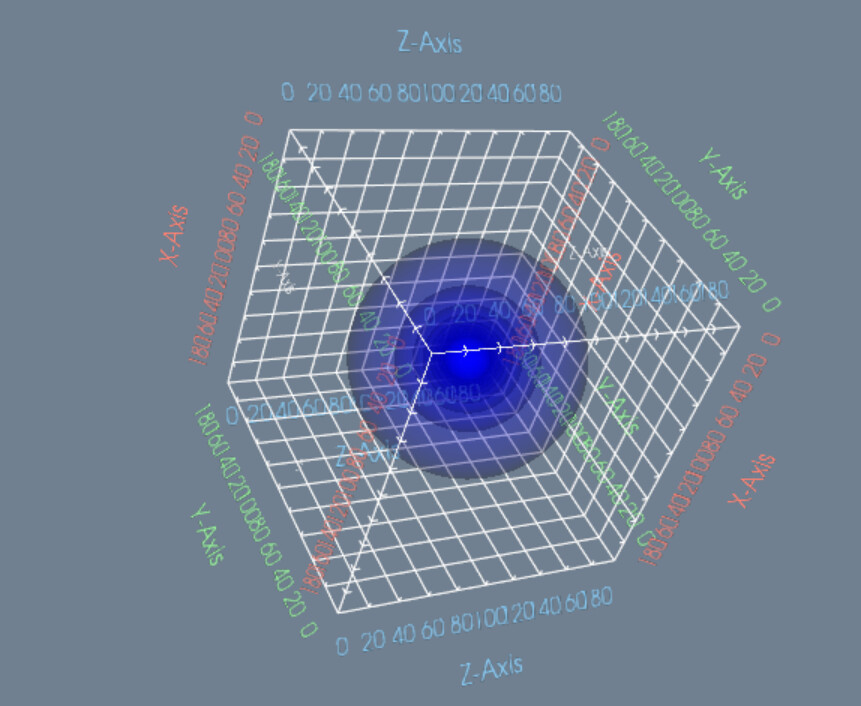
What I’m having some trouble with is:
- The different colors for different levels of the contour seen in the Pyvista example
- The legend showing what color corresponds to what value
- The camera in my VTK solution is centred around that corner of the vtkCubeAxesActor, rather than the centre of the sphere like it is in Pyvista.
I’ve had a dig around the Pyvista source code but it’s got me scratching my head, any advice would be appreciated.
I’ve included my VTK code below:
colors = vtkNamedColors()

axis1Color = colors.GetColor3d("Salmon")
axis2Color = colors.GetColor3d("PaleGreen")
axis3Color = colors.GetColor3d("LightSkyBlue")

x = np.array(np.arange(-steps_range,steps_range,steps))
y = np.array(np.arange(-steps_range,steps_range,steps))
z = np.array(np.arange(-steps_range,steps_range,steps))
data = np.array(calculateData(x, y, z))

image_data = vtkImageData()
image_data.SetOrigin(0, 0, 0)
image_data.SetSpacing(2, 2, 2)
image_data.SetDimensions(100, 100, 100)

image_data.GetPointData().SetScalars(numpy_to_vtk(data.ravel(order='F')))

image_data.Modified()
iso = vtkContourFilter()
iso.SetInputData(image_data)
iso.GenerateValues(10,1000,10000)

mapper = vtkPolyDataMapper()
mapper.SetInputConnection(iso.GetOutputPort())

actor = vtkActor()
actor.SetMapper(mapper)
actor.GetProperty().SetOpacity( 0.2 )
actor.GetProperty().SetColor(1,0.2,0.2)

renderer = vtkRenderer()
ren_win = vtkRenderWindow()
ren_win.AddRenderer(renderer)
iren = vtkRenderWindowInteractor()
iren.SetRenderWindow(ren_win)

cubeAxesActor = vtkCubeAxesActor()
cubeAxesActor.SetUseTextActor3D(1)
cubeAxesActor.SetBounds(image_data.GetBounds())
cubeAxesActor.SetCamera(renderer.GetActiveCamera())
cubeAxesActor.GetTitleTextProperty(0).SetColor(axis1Color)
cubeAxesActor.GetTitleTextProperty(0).SetFontSize(48)
cubeAxesActor.GetLabelTextProperty(0).SetColor(axis1Color)

cubeAxesActor.GetTitleTextProperty(1).SetColor(axis2Color)
cubeAxesActor.GetLabelTextProperty(1).SetColor(axis2Color)

cubeAxesActor.GetTitleTextProperty(2).SetColor(axis3Color)
cubeAxesActor.GetLabelTextProperty(2).SetColor(axis3Color)

cubeAxesActor.DrawXGridlinesOn()
cubeAxesActor.DrawYGridlinesOn()
cubeAxesActor.DrawZGridlinesOn()
cubeAxesActor.SetGridLineLocation(cubeAxesActor.VTK_GRID_LINES_FURTHEST)

cubeAxesActor.XAxisMinorTickVisibilityOff()
cubeAxesActor.YAxisMinorTickVisibilityOff()
cubeAxesActor.ZAxisMinorTickVisibilityOff()

cubeAxesActor.SetFlyModeToStaticEdges()

renderer.AddActor(actor)
renderer.AddActor(cubeAxesActor)
renderer.SetBackground(colors.GetColor3d('SlateGray'))
renderer.GetActiveCamera().Azimuth(30)
renderer.GetActiveCamera().Elevation(30)

ren_win.SetSize(640, 480)
ren_win.SetWindowName('BlankPoint')
ren_win.Render()
iren.Start()