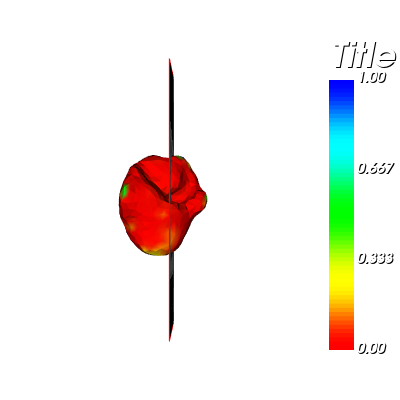
I have two volumetric liver meshes (groundturht and predicted versions) in .vtk format (i.e. ground-truth and predicted versions) and I want to visualise the errors as relative to the magnitude of the deformation on the corresponding 3D CT volume.
I rendered the groundtruth or the predicted meshes seprately on a given CT slice using vtk.
However, when I try to get the mesh difference and render on the same slice, I get an error.
Here is the attached code and a sample meshes file for your further reference.
Could you please help me on resloving this issue.
gtMesh.vtk (101.5 KB)
predMesh.vtk (101.5 KB)
def getMeshPolyData(mesh_path):
    meshReader = vtk.vtkUnstructuredGridReader()
    meshReader.SetFileName(mesh_path)
    meshReader.ReadAllVectorsOn()
    meshReader.ReadAllScalarsOn()
    meshReader.Update()

    meshGeometryFilter = vtk.vtkGeometryFilter()
    meshGeometryFilter.SetInputData(meshReader.GetOutput())
    meshGeometryFilter.Update()

    polyDataForMesh = meshGeometryFilter.GetOutput()

    #meshSurfaceSourcePoints = polyDataForMesh.GetPoints()

    return polyDataForMesh


reader = vtk.vtkNIFTIImageReader()
reader.SetFileName('.deformed_CTs/sample_CT.nii.gz')
reader.Update()
imageMatrix = reader.GetSFormMatrix()
print('imageMatrix:', imageMatrix)
if imageMatrix is None:
    imageMatrix = reader.GetQFormMatrix()
    print('imageMatrix:', imageMatrix)

polyDataForPredMesh = getMeshPolyData('./predictions/predMesh.vtk')
polyDataForGTMesh = getMeshPolyData('/groundtruth/gtMesh.vtk')

# polyDataForMesh = meshGeometryFilter.GetOutput()
predMeshPoints = polyDataForPredMesh.GetPoints()
gtMeshPoints = polyDataForGTMesh.GetPoints()

pointsToImage = vtk.vtkTransform()
pointsToImage.Concatenate(imageMatrix)
pointsToImage.Inverse()

# the newSourcePoints and newTargetPoints are in the same coordinate space as the vtkImageData,
# so they can be used to build the reslice transform.
newPredMeshPoints = vtk.vtkPoints()
pointsToImage.TransformPoints(predMeshPoints, newPredMeshPoints)
newGTMeshPoints = vtk.vtkPoints()
pointsToImage.TransformPoints(gtMeshPoints, newGTMeshPoints)

polyDataForGTMesh.SetPoints(newGTMeshPoints)
polyDataForPredMesh.SetPoints(newPredMeshPoints)

calc1 = vtk.vtkArrayCalculator()
calc1.SetInputData(polyDataForGTMesh)
calc1.AddCoordinateScalarVariable("coordsX", 0)
calc1.AddCoordinateScalarVariable("coordsY", 1)
calc1.AddCoordinateScalarVariable("coordsZ", 2)
calc1.SetResultArrayName("groundtruth")
calc1.Update()

calc2 = vtk.vtkArrayCalculator()
calc2.SetInputData(polyDataForPredMesh)
#calc2.SetAttributeModeToUsePointData()
calc2.AddCoordinateScalarVariable("coordsX", 0)
calc2.AddCoordinateScalarVariable("coordsY", 1)
calc2.AddCoordinateScalarVariable("coordsZ", 2)
calc2.SetResultArrayName("prediction")
calc2.Update()

appendFilter = vtk.vtkAppendFilter()
appendFilter.AddInputData(calc1.GetOutput())
appendFilter.AddInputData(calc2.GetOutput())
appendFilter.Update()

calc3 = vtk.vtkArrayCalculator()
calc3.SetInputData(appendFilter.GetOutput())
calc3.SetFunction("abs(prediction-groundtruth)")
calc3.SetResultArrayName("error")
calc3.Update()

vtkImage = reader.GetOutput()

#outline
outline=vtk.vtkOutlineFilter()
outline.SetInputData(vtkImage)
outlineMapper=vtk.vtkPolyDataMapper()
outlineMapper.SetInputConnection(outline.GetOutputPort())
outlineActor = vtk.vtkActor()
outlineActor.SetMapper(outlineMapper)

meshMapper = vtk.vtkPolyDataMapper()
#meshMapper.SetInputData(polyDataForGTMesh)
meshMapper.SetInputData(calc3.GetOutput())

meshActor = vtk.vtkActor()
meshActor.SetMapper(meshMapper)

#Picker
picker = vtk.vtkCellPicker()
picker.SetTolerance(0.005)

#PlaneWidget
planeWidgetX = vtk.vtkImagePlaneWidget()
planeWidgetX.DisplayTextOn()
planeWidgetX.SetInputData(vtkImage)
planeWidgetX.SetPlaneOrientationToXAxes()
planeWidgetX.SetSliceIndex(200)
planeWidgetX.SetPicker(picker)
planeWidgetX.SetKeyPressActivationValue("x")
prop1 = planeWidgetX.GetPlaneProperty()
prop1.SetColor(1, 0, 0)


#Renderer
renderer = vtk.vtkRenderer()
renderer.SetBackground(0, 0, 1)

#RenderWindow
renwin = vtk.vtkRenderWindow()
renwin.AddRenderer(renderer)

#Add outlineactor
renderer.AddActor(outlineActor)
renderer.AddActor(meshActor)
renwin.SetSize(800,800)

interactor = vtk.vtkRenderWindowInteractor()
interactor.SetRenderWindow(renwin)

#Load widget interactors and enable
planeWidgetX.SetInteractor(interactor)
planeWidgetX.On()
# planeWidgetY.SetInteractor(interactor)
# planeWidgetY.On()
# planeWidgetZ.SetInteractor(interactor)
# planeWidgetZ.On()

interactor.Initialize()
renwin.Render()
interactor.Start()
