VTK Gradient Filter

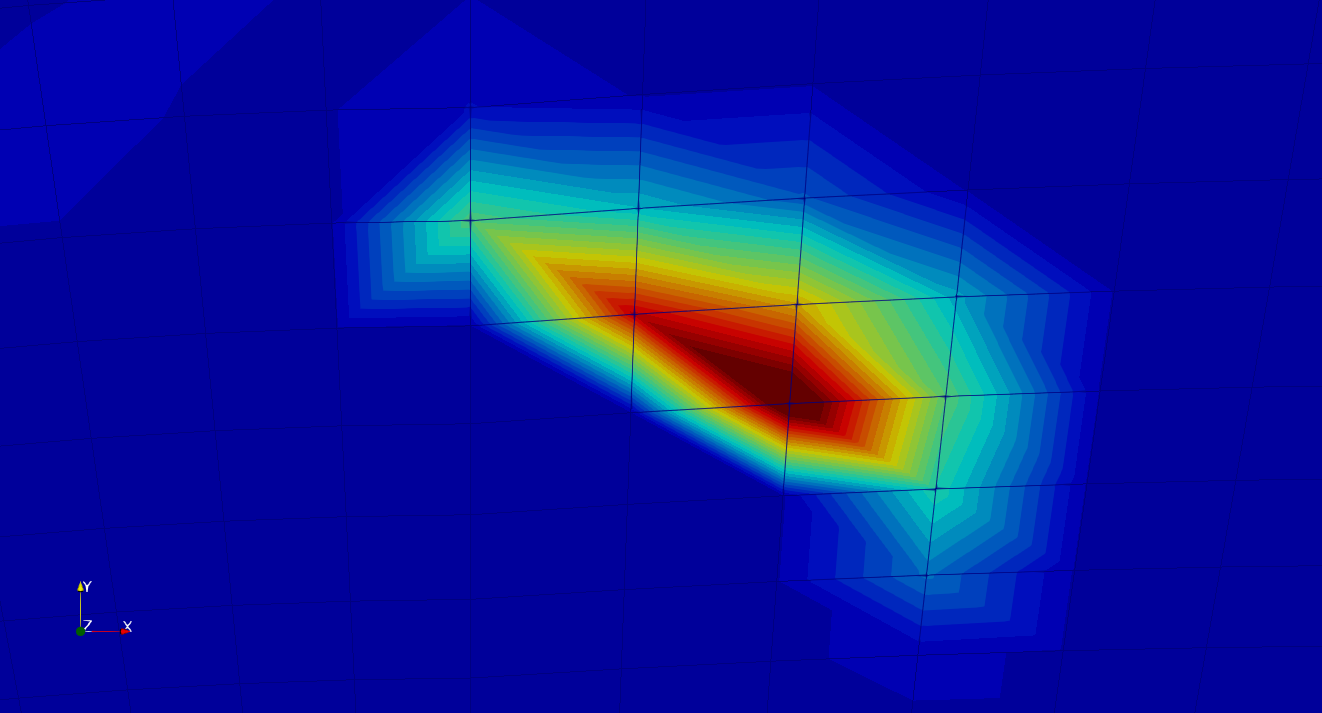
I am using the vtkGradientFilter in Python in order to compute velocity gradients from a vtkUnstructuredGrid file with a snippet shown below. However, when visualised in Paraview the results seem quite blocky and coarse. Is there any way to improve the quality of the output with the gradient filter or is it completely dependent on the mesh? Additionally, can anyone provide substantial documentation for vtkGradientFilter. I have found the basic description but was hoping for some more detail.

reader = vtk.vtkUnstructuredGridReader()
data = reader.GetOutput()

gradient = vtk.vtkGradientFilter()
gradient.SetInputData(data)
gradient.SetInputScalars(0, "Velocity") 
gradient.SetResultArrayName("Velocity Gradient")
gradient.Update()

This coarseness is a result of the mesh resolution itself, not the filter. You only have data values on the nodes of the mesh and the colors are be interpolated between those nodes. I’d recommend trying to increase your mesh’s resolution or playing around with different rendering techniques (i.e. make sure interpolate before mapping is enabled in the ParaView options).

If you are using Python, I highly recommend using PyVista: https://docs.pyvista.org which is a more Pythonic interface to VTK. And it has some more documentation on how to use the gradient filter:

see also: Gradient of Unstrucutred Grid in Python

If the input file has a VTK Unstructured Grid, how would it be converted to be read by PyVista? I receive the error that I am missing the ‘dataset’ positional argument when i try:

mesh = pv.DataSetFilter.compute_gradient(scalars="Velocity")

Below is my code for reading the VTK file mesh:

filename = 'soln_volume_CFD_00290.vtk'
reader = vtk.vtkUnstructuredGridReader()
reader.SetFileName(filename)
reader.ReadAllScalarsOn()
reader.ReadAllVectorsOn()
reader.ReadAllTensorsOn()
reader.Update()
data = reader.GetOutput() # the mesh

density_vtk_array = data.GetPointData().GetArray(0)
momentum_vtk_array = data.GetPointData().GetArray(1)
density_numpy_array = np.array(density_vtk_array)
momentum_numpy_array = np.array(momentum_vtk_array)

res = list(map(truediv, momentum_numpy_array, density_numpy_array))
velocity = np.array(res)
velocity_vtk_arr = numpy_to_vtk(velocity)
velocity_vtk_arr.SetName("Velocity")
data.GetPointData().AddArray(velocity_vtk_arr)

Try this:

import pyvista as pv

filename = 'soln_volume_CFD_00290.vtk'
data = pv.read(filename)

mesh = data.compute_gradient(scalars="Velocity")

mesh["gradient"]
mesh.plot(scalars="gradient")
1 Like

Looks to be working thank you. Was wondering if there is any detailed documentation on the method used i.e. is it the same central differencing and interpolation method used by the VTK function?

PyVista is nothing more than a wrapper around VTK, so yes, PyVista is the same as the VTK filter. The docs for vtk.vtkGradientFilter have the most info, albeit not much: https://vtk.org/doc/nightly/html/classvtkGradientFilter.html#details