DavidA
November 17, 2023, 3:38pm
1
I have written C++ code for a Stacked Bar / Line plot but I am not getting the proper legend and I cannot work out why.
The legend works fine in a simple Bar / Line plot, but as soon as I introduced a second input array for the vtkPlotBar to make it a stacked bar, the line info in the legend disappeared.
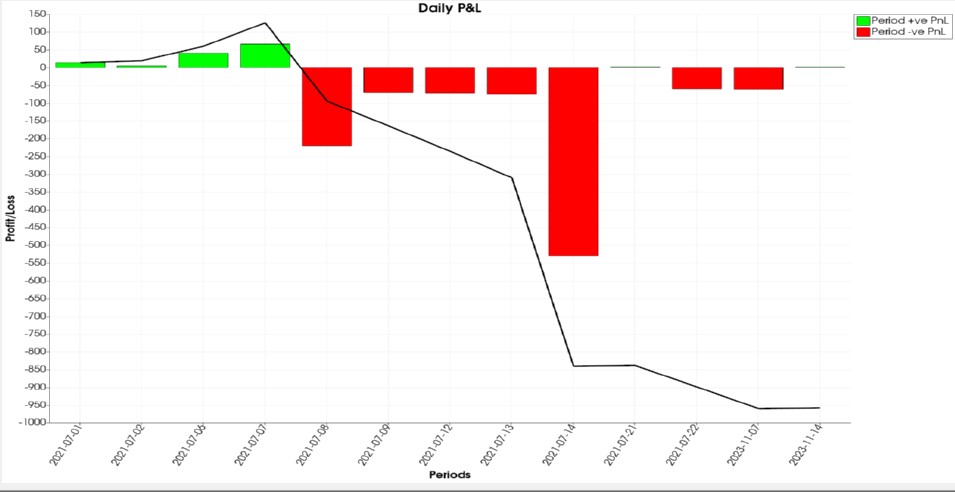
I have attached the resulting chart. As you can see I am using a stacked bar to get bars with different colours. Green for positive bars and red for negative bars. The line is the cumulative sum. The legend is only showing the bar info for some reason.
The part of the code that changed to add the stacked bar and resulted in the missing “line” info in the legend is below.
Am I doing something fundamentally wrong here? Appreciate any advice that can be offered.
  // Add the Bar or Line Plot for yData_ (first column is always the Bar data)
  vtkPlot*    line;
  vtkPlotBar* bar;

  vtkNew<vtkColorSeries> customColourSeries;
  customColourSeries->ClearColors();
  vtkColor3ub green(0, 255, 0);
  vtkColor3ub red(255, 0, 0);
  customColourSeries->AddColor(green);
  customColourSeries->AddColor(red);

  bar = vtkPlotBar::SafeDownCast(chart->AddPlot(vtkChart::BAR));
  bar->SetColorSeries(customColourSeries);
  bar->SetOrientation(vtkPlotBar::VERTICAL);
  bar->SetInputData(table, 0, 1);
  bar->SetInputArray(2, yLabels_[1]);

  line = chart->AddPlot(vtkChart::LINE);
  line->SetInputData(table, 0, 3);
  line->SetColor(0, 0, 0, 255); // Black line.
  line->SetWidth(3.0);
  line->SetLegendVisibility(true);
DavidA
November 18, 2023, 7:49am
2
After some playing around, if you create the Line Plot before the Stacked Bar Plot then the legend displays correctly.
Unfortunately this puts the line behind the bars and I wanted it the other way around.
This seems like a bug in VTK.
Any comments?
Hello,
Can you, please, share more of the code? For example, how you create and configure the chart object is important.
best,
PC
DavidA
November 19, 2023, 1:56am
4
Here is the full code for building my chart. Note that this is a member function which is part of a class and there are variables declared and assigned outside this function. Basically all variables ending in “underscore ” are member variables. The data (xData_ & yData_) is passed in Armadillo matrices (https://arma.sourceforge.net/ )
private:
  HWND        parentWnd_;
  int         chartWidth_;
  int         chartHeight_;
  int         numLabels_;
  bool        showLegend_;
  std::string xTitle_;
  std::string yTitle_;
  std::string title_;
  double      xAxisMin_;
  double      xAxisMax_;
  double      yAxisMin_;
  double      yAxisMax_;

  const std::vector<std::string> xLabels_;
  const std::vector<std::string> yLabels_;
  const arma::mat                xData_;
  const arma::mat                yData_;
std::vector<unsigned char> VTKCharts::BarLinePlot()
{
  // Basic sanity checks
  if (xData_.n_rows != yData_.n_rows)
    return std::vector<unsigned char>();

  // Setup the 2D scene and add an XY chart
  vtkNew<vtkContextView> view;
  vtkNew<vtkNamedColors> colours;
  vtkRenderWindow*       rdrWin = view->GetRenderWindow();
  rdrWin->SetSize(chartWidth_, chartHeight_);
  rdrWin->SetParentId(parentWnd_);
  rdrWin->GlobalWarningDisplayOff();
  rdrWin->SetWindowName("Bar/Line Plot");
  view->GetRenderer()->SetBackground(colours->GetColor3d("white").GetData());

  vtkNew<vtkChartXY> chart;
  view->GetScene()->AddItem(chart);

  // Chart Settings
  chart->SetTitle(title_);
  chart->GetTitleProperties()->BoldOn();
  chart->GetTitleProperties()->SetFontSize(24);
  chart->SetShowLegend(showLegend_);
  chart->GetTitleProperties()->SetFontSize(24);
  chart->SetDrawAxesAtOrigin(false);

  // Legend Settings
  vtkChartLegend* legend = chart->GetLegend();
  legend->SetLabelSize(18);
  legend->SetInline(false);
  legend->SetHorizontalAlignment(vtkChartLegend::RIGHT);
  legend->SetVerticalAlignment(vtkChartLegend::TOP);

  // X-Axis Settings
  vtkAxis* xAxis = chart->GetAxis(vtkAxis::BOTTOM);
  xAxis->SetTitle(xTitle_);
  xAxis->GetTitleProperties()->SetFontSize(20);
  xAxis->GetLabelProperties()->SetFontSize(18);
  xAxis->GetLabelProperties()->SetOrientation(60);
  xAxis->GetLabelProperties()->SetVerticalJustification(VTK_TEXT_CENTERED);
  xAxis->GetLabelProperties()->SetJustification(VTK_TEXT_RIGHT);
  xAxis->SetLabelOffset(10);

  if (xAxisMin_ != xAxisMax_)
  {
    chart->GetAxis(vtkAxis::BOTTOM)->SetBehavior(vtkAxis::AUTO);
    chart->GetAxis(vtkAxis::BOTTOM)->SetMinimum(xAxisMin_);
    chart->GetAxis(vtkAxis::BOTTOM)->SetMaximum(xAxisMax_);
  }
  else
  {
    chart->GetAxis(vtkAxis::BOTTOM)->SetBehavior(vtkAxis::AUTO);
  }

  // Y-Axis Settings
  vtkAxis* yAxis = chart->GetAxis(vtkAxis::LEFT);
  yAxis->SetTitle(yTitle_);
  yAxis->GetTitleProperties()->SetFontSize(20);
  yAxis->GetLabelProperties()->SetFontSize(18);

  if (yAxisMin_ != yAxisMax_)
  {
    chart->GetAxis(vtkAxis::LEFT)->SetBehavior(vtkAxis::FIXED);
    chart->GetAxis(vtkAxis::LEFT)->SetMinimum(yAxisMin_);
    chart->GetAxis(vtkAxis::LEFT)->SetMaximum(yAxisMax_);
  }
  else
  {
    chart->GetAxis(vtkAxis::LEFT)->SetBehavior(vtkAxis::AUTO);
  }

  //////////////////////////////////////////////////////
  // Create vtkTable for holding chart data and add the
  // columns to it ...
  //
  vtkNew<vtkTable> table;

  // X-Axis = column 0 in the values
  vtkNew<vtkDoubleArray> xVtkData;
  xVtkData->SetName("Date");
  table->AddColumn(xVtkData);

  // Y-Axis columns added in loop (each column of data represents a plot).
  std::vector<vtkNew<vtkDoubleArray>> yData;
  for (size_t col = 0; col < yData_.n_cols; ++col)
  {
    yData.emplace_back(vtkNew<vtkDoubleArray>{});

    yData[col]->SetName(yLabels_[col].c_str());
    table->AddColumn(yData[col]);
  }
  //
  //////////////////////////////////////////////////////

  //////////////////////////////////////////////////////
  // ... then set the values in the vtkTable.

  const int numPoints = yData_.n_rows;
  table->SetNumberOfRows(numPoints); // Allocates memory in the vtkTable. Must be done before adding data.

  // Add the X-Values from the xData_ matrix.
  for (int row = 0; row < numPoints; ++row)
    table->SetValue(row, 0, xData_(row, 0));

  // Add the Y-Values from the yData_ matrix to remaining columns and add the plot to the chart for each column.
  for (size_t col = 0; col < yData_.n_cols; ++col)
    for (int row = 0; row < numPoints; ++row)
      table->SetValue(row, col + 1, yData_(row, col));

  // Add the Bar or Line Plot for yData_
  vtkPlotLine* line;
  vtkPlotBar*  bar;

  vtkNew<vtkColorSeries> customColourSeries;
  customColourSeries->ClearColors();
  vtkColor3ub green(0, 255, 0);
  vtkColor3ub red(255, 0, 0);
  customColourSeries->AddColor(green);
  customColourSeries->AddColor(red);

  bar = vtkPlotBar::SafeDownCast(chart->AddPlot(vtkChart::BAR));
  bar->SetColorSeries(customColourSeries);
  bar->SetOrientation(vtkPlotBar::VERTICAL);
  bar->SetInputData(table, 0, 1);
  bar->SetInputArray(2, yLabels_[1]);

  line = vtkPlotLine::SafeDownCast(chart->AddPlot(vtkChart::LINE));
  line->SetInputData(table, 0, 3);
  line->SetColor(0, 0, 0, 255); // Black line.
  line->SetWidth(3.0);
  // dynamic_cast<vtkPlotPoints*>(points)->SetMarkerStyle(vtkPlotPoints::CROSS);

  //////////////////////////////////////////////////////
  // Add the X-Axis Labels if they are provided
  if (!xLabels_.empty())
  {
    vtkNew<vtkDoubleArray> dates;
    vtkNew<vtkStringArray> xlabs;
    dates->SetNumberOfValues(numPoints);
    xlabs->SetNumberOfValues(numPoints);
    dates->SetValue(0, 0);
    xlabs->SetValue(0, xLabels_[0].c_str());
    dates->SetValue(numPoints - 1, numPoints - 1);
    xlabs->SetValue(numPoints - 1, xLabels_[numPoints - 1].c_str());

    int rowSkip = std::max(1, numPoints / (numLabels_ - 2));

    for (int row = rowSkip; row < numPoints - rowSkip; row += rowSkip)
    {
      dates->SetValue(row, row);
      xlabs->SetValue(row, xLabels_[row].c_str());
    }

    xAxis->SetCustomTickPositions(dates, xlabs);
  }

  // Render the chart
  view->GetRenderWindow()->SetOffScreenRendering(true);
  view->GetRenderWindow()->Render();
  vtkNew<vtkWindowToImageFilter> filter;
  filter->SetInput(view->GetRenderWindow());
  filter->Update();

  vtkNew<vtkPNGWriter> wtr;
  wtr->SetInputConnection(filter->GetOutputPort());
  wtr->WriteToMemoryOn();
  wtr->Write();
  vtkUnsignedCharArray* arr     = wtr->GetResult();
  size_t                nbrVals = arr->GetNumberOfValues();

  std::vector<unsigned char> imgData(nbrVals);
  memcpy(imgData.data(), static_cast<unsigned char*>(arr->GetVoidPointer(0)), nbrVals);

  return imgData; // NVRO ensures no copy on return. Tested.
}
Try using one of these vtkChartXY’s methods to place the line chart on top after you get the desired result:
vtkIdType RaisePlot (vtkPlot *plot)plot to the top of the plot’s stack. More…
virtual vtkIdType StackPlotAbove (vtkPlot *plot, vtkPlot *under)plot above the under plot. More…
vtkIdType LowerPlot (vtkPlot *plot)plot to the bottom of the plot’s stack. More…
virtual vtkIdType StackPlotUnder (vtkPlot *plot, vtkPlot *above)plot under the above plot. More…
I hope any of these helps.
regards,
PC
DavidA
November 20, 2023, 2:44am
6
Thanks for the suggestion. It works and resolves my problem although it seems like a workaround.
Steps:
Load the LINE plot to the chart first.
Load the BAR plot(s)
Raise the LINE to the top by vtkChartXY::RaisePlot(vtkPlot*)
Now the bigger question is why we need to do it this way to get the legend to work correctly. Is this a bug in the VTK software or is this a documented feature somewhere that I missed?
For those interested, here is the final chart:
If you think it’s a bug, please report it here: https://gitlab.kitware.com/vtk/vtk/-/issues .
take care,
PC