Hello Everyone,
I’m using vedo to create a network with nodes and edges and color the nodes using the scalar values stored in an array. From what I understand, vedo uses vtkScalarBarActor to associate the scalar values to colors.
Code:
import networkx as nx
from vedo import *

G = nx.gnm_random_graph(n=10, m=15, seed=1)
nxpos = nx.spring_layout(G)
nxpts = [nxpos[pt] for pt in sorted(nxpos)]

nx_lines = []
for i, j in G.edges():
    p1 = nxpos[i].tolist() + [0]  # add z-coord
    p2 = nxpos[j].tolist() + [0]
    nx_lines.append([p1, p2])

nx_pts = Points(nxpts, r=12)
nx_edg = Lines(nx_lines).lw(2)

# node values
vals = [100, .80, .10, .79, .70, .60, .75, .78, .65, .90]
nx_pts.pointColors(vals, cmap='YlGn', vmin=min(vals), vmax=max(vals)).addScalarBar()
show(nx_pts, nx_edg, nx_pts.labels('id'), interactive=True, bg='black', title='plot')
I’m facing a problem when there are outliers in the scalar values.

vals = [100, .80, .10, .79, .70, .60, .75, .78, .65, .90] in here there is one outlier and due to this the rest of the values are assigned a single color. I would like to ask for suggestions on how to avoid the above and create a scalarbar like the following
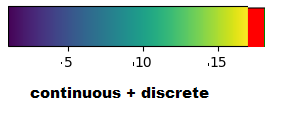
The red discrete patch in the bottom representation is for the outliers (i.e 100 in vals = [100, .80, .10, .79, .70, .60, .75, .78, .65, .90])
More details on the same issue can be found here