I was wondering if I could get some help/clarification on a few things.
I have a 30x30x30 rectilinear grid vtk file, this has been pre generated using the pyevtk python extension(GridToVtk). I have successfully read it in and applied the vtkRectilinearGridGeometryFilter() which once renders allows me to view all the points of this grid.
In my grid, each point has 10 variables which I want to now use this data to draw isosurfaces. I cant seem to figure how I can access these ‘varaibles’ inside VTK which are stored at each point.
I have done lots of research into vtkContourFilter and MarchingCubes and fully understand how they work. I am not just sure how to set them to ‘draw’ on the point data variables inside the grid.
When using algorithms like vtkContourFilter where a scalar array is proccessed, you’ll have to call .SetInputArrayToProcess(**args):
alg = vtk.vtkContourFilter()
alg.SetInputDataObject(dataset)

# args: (idx, port, connection, field, name)
alg.SetInputArrayToProcess(0, 0, 0, field, scalars)

# make 10 contours between range -1 and 1
alg.GenerateValues(10, [-1, 1])
alg.Update()

result = alg.GetOutput()
Easier Implementation
You may benefit from giving vtki a try - it’s a streamlined Python interface to VTK. Your problem description would translate to:
import vtki
import numpy as np
#######
# Create a similar dataset (30 by 30 by 30)
xrng = yrng = zrng = np.arange(-15, 15, 1)
grid = vtki.RectilinearGrid(xrng, yrng, zrng)
# Add ten scalar arrays
for i in range(10):
grid.cell_arrays['scalar-{}'.format(i)] = np.random.rand(grid.n_cells)
# Or load from a data file
# grid = vtki.read('my-file.vtr')
#######
# Move all data to nodes
nodal = grid.cell_data_to_point_data()
# Extract external surface
geom = nodal.extract_geometry()
# Countour the 3D volume by the 'scalar-2' array
contours = nodal.contour(scalars='scalar-2')
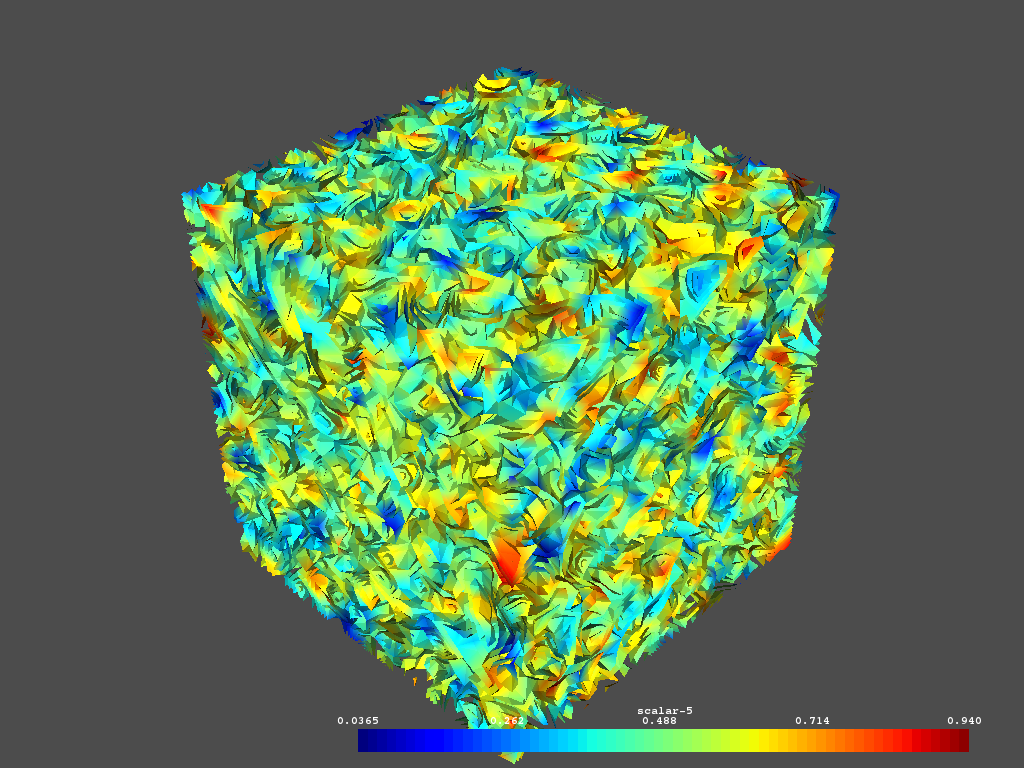
# Plot by some other array
contours.plot(scalars='scalar-5')
Great thank you, I have successfully managed to get both methods working! Thanks for your quick and detailed reply. I have just one follow up question.
I am struggling to understand the arguments for SetInputArrayToProcess. I currently have them as 0,0,0,0,[‘u’]). With ‘u’ being the scalars value in the array. Im unsure how they all link and how I can change etc. The information on the doc is hard to understand.
Also, when I set ‘arr = output.GetPointData().GetScalars(‘u’)’… I never actually use ‘arr’. Do I need this?