I am using vtk.vtkContourFilter to create isolines from a dataset.
Everything seems to work fine, but any contour values I specify <= 0 don’t seem to generate, even though there is definitely data with those values.
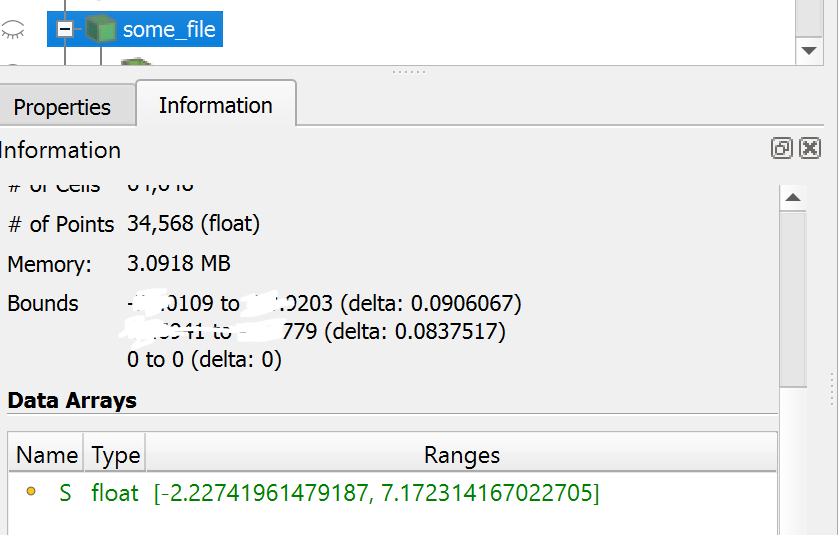
I am trying to contour this scalar ‘S’ in my unstructured grid file. I can see in paraview there are definitely values below 0, and can create the contours in paraview fine.
This is my code to create the contours:
reader = vtk.vtkUnstructuredGridReader()
reader.SetFileName('file.vtk')
reader.Update()
out = reader.GetOutput()
out.GetPointData().SetActiveScalars('S')
cnt = vtk.vtkContourFilter()
cnt.SetInputData(out)
cnt.GenerateValues(9,-4,4)
cnt.SetOutputPointsPrecision(1) #my lines are very janky if I use 0 or 2
cnt.Update()
lines=cnt.GetOutput()
writer = vtk.vtkPolyDataWriter()
writer.SetInputData(lines)
writer.SetFileName('wow.vtk')
writer.Write()
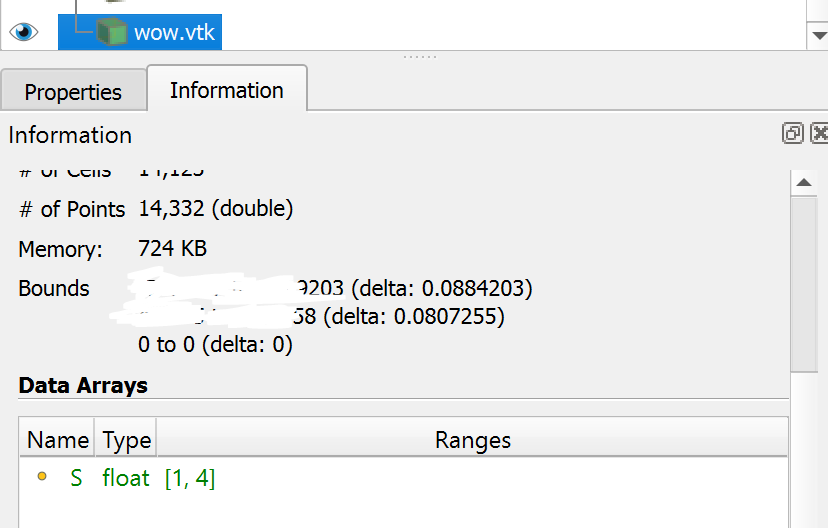
When I visualize the output, there’s nothing above 0 for whatever reason. I’ve tried using SetNumberOfContours and setting values manually too, same result.
How can I make the filter contour the negative scalar values properly?
I feel like I am missing something basic.

