The vtkPolyDataEdgeConnectivityFilter works fine, it is crashing because it needs polygons, not just lines.
Here is a solution in vedo, (uncomment reverse() to have it clockwise):
from vedo import *
m = Mesh("poly1.vtk").clean().triangulate()
ms = m.split(must_share_edge=True) # return a list of meshes
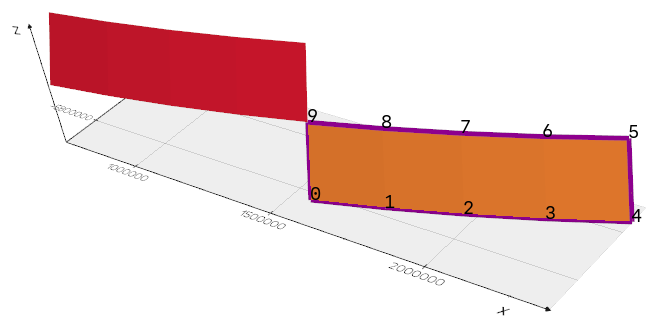
s1 = ms[0].boundaries().join_segments()[0]#.reverse()
print("First polyline", s1.points())
show(ms, s1, s1.labels2d(), axes=1)
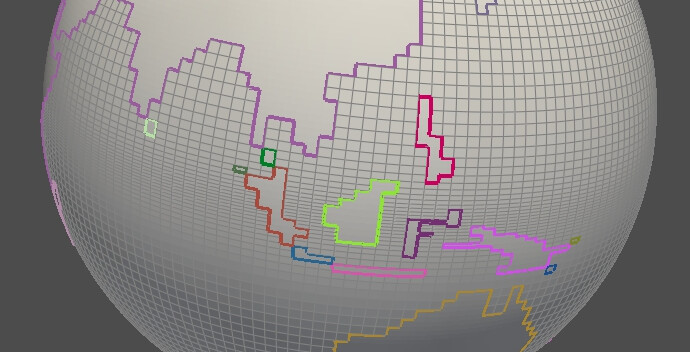
I can reproduce what the vedo code from @marcomusy has proposed with the VTK API.
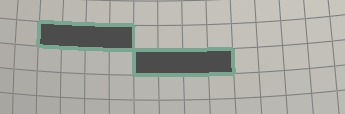
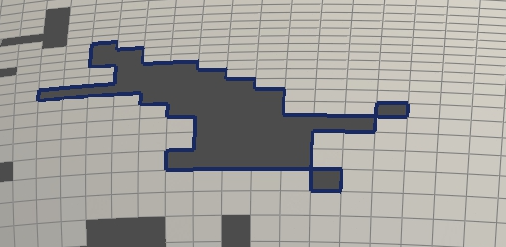
But the split function from the vedo code gives anyway an uncorrect number of regions.
Notice that all the different self intersected polygons are separated from their duplicate points into multiple polygons.
import pyvista as pv
import vtk
import random
import numpy as np

! wget -nc https://thredds-su.ipsl.fr/thredds/fileServer/ipsl_thredds/brocksce/tmp/mesh3D_03.vtk
mesh = pv.PolyData('mesh3D_03.vtk')

edges = mesh.extract_feature_edges(boundary_edges=True)

pl = pv.Plotter()

R = 6371E3
pl.add_mesh(pv.Sphere(radius=R*0.999, theta_resolution=360, phi_resolution=180))
pl.add_mesh(mesh, show_edges=True, edge_color="gray")

regions = edges.connectivity()
regCount = len(set(regions.get_array("RegionId")))

connectivityFilter = vtk.vtkPolyDataConnectivityFilter()
stripper = vtk.vtkStripper()

allPolys = []
for r in range(regCount):
    connectivityFilter.SetInputData(edges)
    connectivityFilter.SetExtractionModeToSpecifiedRegions()
    connectivityFilter.InitializeSpecifiedRegionList()
    connectivityFilter.AddSpecifiedRegion(r)
    connectivityFilter.Update()

    stripper.SetInputData(connectivityFilter.GetOutput())
    stripper.SetJoinContiguousSegments(True)
    stripper.Update()

    cleaner = vtk.vtkCleanPolyData()
    cleaner.SetInputData(stripper.GetOutput())
    cleaner.Update()

    reg = cleaner.GetOutput()
    print(r, reg.GetNumberOfCells(), reg.GetNumberOfPoints())

    #==============================
    polys = []
    for cellIndex in range(reg.GetNumberOfCells()):

        c = reg.GetCell(cellIndex)
        print("  Cell #%d Number of points: %d"  %(cellIndex, c.GetNumberOfPoints()))

        d = c.GetPointIds()

        ids = []
        for idIndex in range(d.GetNumberOfIds()):
            ids.append(d.GetId(idIndex))

        unique, count = np.unique(ids, return_counts=True)
        dup = unique[count > 1]

        for id in dup[::-1]:
            select = np.where(ids == id)[0]
            polys.append(ids[select[0]:select[1]+1])
            idsIndices = list(range(select[0],select[1]))
            ids = list(np.delete(ids, idsIndices))

    print("  ", len(polys))
    for p in polys:
        points = []
        for id in p:
            points.append(reg.GetPoint(id))
        m1 = pv.MultipleLines(points)
        print("  add poly")
        allPolys.append(points)

        random_color = "#"+''.join([random.choice('0123456789ABCDEF') for i in range(6)])
        pl.add_mesh(m1, color=random_color, line_width=4)

viewer = pl.show(jupyter_backend='trame', return_viewer=True)
display(viewer)
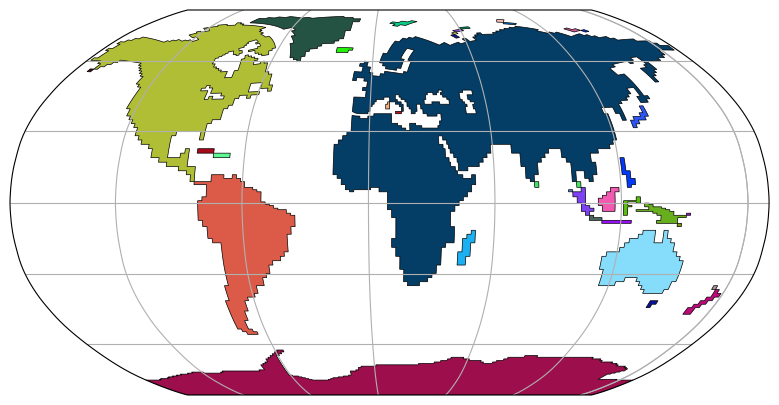
Then my intention was to produce maps with filled polygons in various projections.
have a look to
The polygon file polys_03.pickle can be produced from
import shapely
from pyproj import Transformer

#=======================================================
# From a cartesian 3D CS (geocentric) to a global latitude/longitude CS
trans_GPS_to_XYZ = Transformer.from_crs(4978, 4326, always_xy=True)

#=======================================================
# Define a function to make continuous the polygon
# because the projection transformation produces output
# between -180 and 180

def makePolygonContinuous(arrayLonLat):
    for i in range(1,len(arrayLonLat)):
        lon1 = arrayLonLat[i-1][0]
        lon2 = arrayLonLat[i][0]
        if (abs(lon2-360-lon1) < abs(lon2-lon1)):
            arrayLonLat[i][0] = lon2-360
        elif (abs(lon2+360-lon1) < abs(lon2-lon1)):
            arrayLonLat[i][0] = lon2+360

    return arrayLonLat

#=======================================================
allPolys2 = []
for polyIndex in range(len(allPolys)):
    print(polyIndex, len(allPolys[polyIndex]))
    points = []
    for point in allPolys[polyIndex]:
        x,y,z = point
        lon, lat, Z = trans_GPS_to_XYZ.transform(x,y,z)
        points.append([lon, lat])

    points = makePolygonContinuous(points)

    polygonShapely = shapely.Polygon(points)
    polygonShapelyOriented = shapely.geometry.polygon.orient(polygonShapely)

    allPolys2.append(polygonShapelyOriented)

#=======================================================
import pickle
pickle.dump(allPolys2, open("polys_03.pickle","wb"))