But the problem could be solved from a VTK point of view by creating separate regions even if they are connected by a single vertex (extract_feature_edges). I have not been able to do that
and this is the purpose of my question.
Here is snippet for testing.
import pyvista as pv
import vtk
import random
! wget -q -nc https://thredds-su.ipsl.fr/thredds/fileServer/ipsl_thredds/brocksce/pyvista/mesh3D.vtk
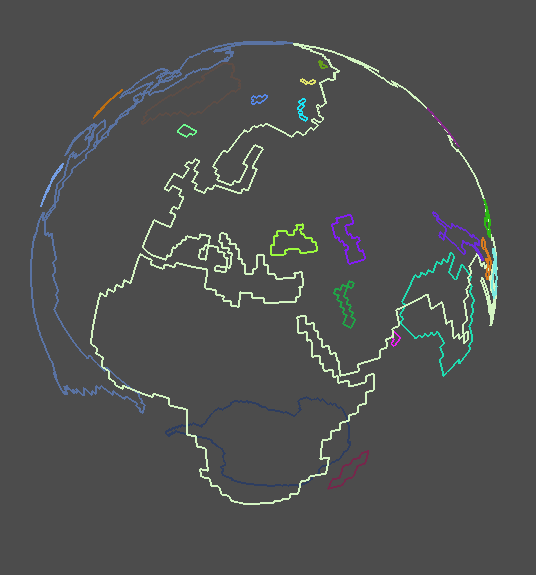
mesh = pv.PolyData('mesh3D.vtk')
edges = mesh.extract_feature_edges(boundary_edges=True)
pl = pv.Plotter()
R = 6371E3
#pl.add_mesh(pv.Sphere(radius=R*0.999, theta_resolution=360, phi_resolution=180))
#pl.add_mesh(mesh, show_edges=True, edge_color="gray")
regions = edges.connectivity()
regCount = len(set(pv.get_array(regions, name="RegionId")))
connectivityFilter = vtk.vtkPolyDataConnectivityFilter()
stripper = vtk.vtkStripper()
for r in range(regCount):
connectivityFilter.SetInputData(edges)
connectivityFilter.SetExtractionModeToSpecifiedRegions()
connectivityFilter.InitializeSpecifiedRegionList()
connectivityFilter.AddSpecifiedRegion(r)
connectivityFilter.Update()
stripper.SetInputData(connectivityFilter.GetOutput())
stripper.SetJoinContiguousSegments(True)
stripper.Update()
reg = stripper.GetOutput()
random_color = "#"+''.join([random.choice('0123456789ABCDEF') for i in range(6)])
pl.add_mesh(reg, color=random_color, line_width=2)
viewer = pl.show(jupyter_backend='pythreejs', return_viewer=True)
display(viewer)
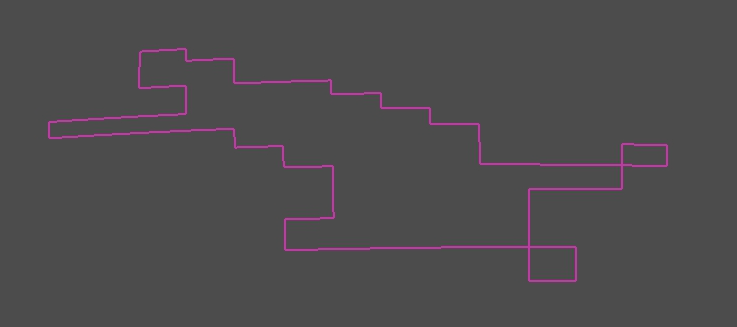
and zoomed here is an example of an extracted region :
that I would like to separate and be seen as 2 distinct regions. I will then be able to describe for each polygon their coordinates anti-clockwise as requested by the matplotlib path structure.
My two cents on it is that you need to preprocess geometry data to:
duplicate vertexes that connect to more than two vertexes;
for each of the resulting pairs, set the connectivity of the two collocated vertexes such that you have two closed polygons and not a single self intersecting one.
Libraries you can try: Overview (Clipper2, a small library with an algorithm that does what you need for C++, C# and Delphi). CGAL 5.5.1 - 2D Arrangements: User Manual (CGAL, a massive C/C++ library of industry-level, high-performing and accurate computational geometry algorithms that has what you need).
Well, it’s likely doable in VTK only by combining two or more filters, but off the top of my head I don’t know how. Please, take a look at this chapter about VTK’s advanced CG algorithms: https://kitware.github.io/vtk-examples/site/VTKBook/09Chapter9/ .
I assume you’re running in a Python notebook. Can you try running it as a Python script? Running as notebooks often results in important feedback being ignored (e.g. error messages).
See above.
Please download the mesh3D.vtk file with a: wget -q -nc https://thredds-su.ipsl.fr/thredds/fileServer/ipsl_thredds/brocksce/pyvista/mesh3D.vtk
The script runs with vtkPolyDataConnectivityFilter(), not with vtkPolyDataEdgeConnectivityFilter()
So, a core dump means you had an abend. Besides the core dump, was there any higher-level messages (e.g. Python stack trace or OpenGL error messages)? If not, even a core dump can provide some insight to what went wrong depending on where exactly the crash ensued.
Can you identify which executable crashed? Depending on the answer, it’ll be easy or difficult to analyze the dump. For example, if the crash occured inside python or libvtkCommonCore-9.1.dll you can get debug versions of these with relative ease. If the crash took place inside one of the OpenGL backend libraries, you can have a hard time getting the debug version of them because they are supplied by your graphics card vendor.
No. I haven’t been able to investigate the core dump.
Honnestly I was expecting that someone confirms that problem.
The solution to change connectivityFilter = vtk.vtkPolyDataConnectivityFilter()
by connectivityFilter = vtk.vtkEdgesPolyDataConnectivityFilter()
is easy to test.
An abend like that does not necessarily happen with others. So, only posting the high-level code that triggers it does not mean that much. Hence, it can be a long time until someone experiences the same problem as yours as these mysterious crashes often have a multitude of causes. Python code depends on piles and piles of lower level APIs. The crash can be starting in any of them. If you wish the community to help you, the least you can do is to get human-readable information on the dump following the steps presented and share them here.
If you don’t feel like getting into the trouble of using a debugger to have an inteligible core dump, I believe your options are:
a) waiting;
b) use a work around;
c) hire someone more experienced to do it for you.
Anyway, have you tried a trivial data set? Maybe the crash is caused by some oddity in the data.
I am investigating trying to understand why changing the filter causes an abend.
Have you tried the code I have proposed ? It is quite simple.
I will try to reduce it more and test indeed this vtkPolyDataEdgeConnectivityFilter that causes problem.
In fact the problem I am facing is how to describe anti-clockwise a polygon. The vtk.vtkPolyDataConnectivityFilter() extract correctly a region. The vtk.vtkStripper() and stripper.SetJoinContiguousSegments(True) joins each segments as one entity but I need to describe the polygon with an anti-clockwise convention.
These methods are reliable in case of self intersecting polygons provided there is a great assimetry in the proportion of clockwise and anti-clockwise portions such as your example just above. One can see that it is “mostly” clockwise or counter-clockwise.
The solution could be to separate the polydata into convex polygons that then can be oriented correctly.
What do you think of this ? And how to do it ?