I am trying to create an isosurface plot from a vtkImageData. I have a numpy array which has the scalar fields. I kept the scalar field as 0 and 1 for testing. Given below is my pipeline:
import vtk
from vtk.util import numpy_support
import numpy as np

# Load scalar data from npy file
scalars=np.load("Scalar.npy")

# Convert numpy array to vtk
scalars=numpy_support.numpy_to_vtk(scalars)
scalars.SetName("Scalar")

# Create a vtkImageData
grid =vtk.vtkImageData()
grid.SetDimensions(251, 251, 101)
grid.SetSpacing(0.1, 0.1, 0.1)
grid.SetOrigin(0,0,0)

# Add scalar field to the ImageData
grid.GetPointData().AddArray(scalars)

# Get Isosurface using contour filter
contourFilter = vtk.vtkContourFilter()
contourFilter.SetInputData(grid)
contourFilter.SetArrayComponent (0)
contourFilter.SetValue(0, 1)
contourFilter.Update()
outData=contourFilter.GetOutput()
However, I am unable to get the isosurface from the contour filter. The number of points in outData outData. GetNumberOfPoints() is giving 0. However, I have value 1 at 211573 places. np.count_nonzero(scalars[scalars==1]) gives 211573. I have saved the numpy array used in the above code here.
Please help me to solve this issue and understand what I am doing wrong here.
Hi @will.schroeder
isovalue ==0.5 ( contourFilter.SetValue(0, 0.5)) is also giving outData.GetNumberOfPoints() as 0, I mean contour filter is returning empty polydata.
Yes, but I am not sure what to check. The size of numpy array which I am assigning as scalar is of the same size as no of points in vtkImageData. I am a bit confused here. Is there any issue in the way I create vtkImageData?
I found the mistake. To add the scalar data to vtkImageData, I have to use grid.GetPointData().SetScalars(scalar) method rather than grid.GetPointData().AddArray(scalars) method. Now I am getting points in the vtkContourFilter output.
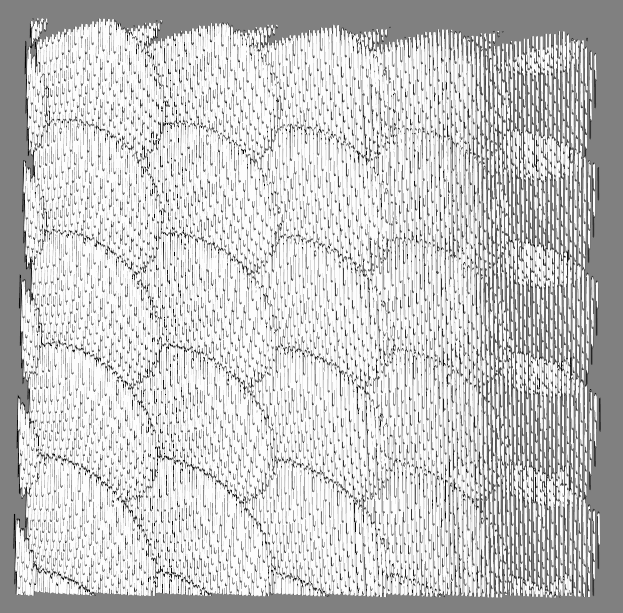
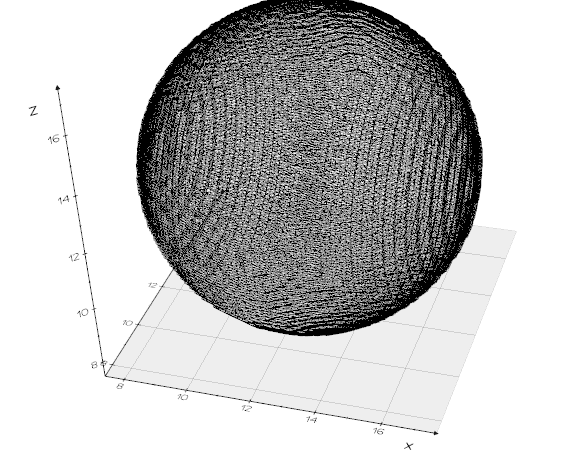
However, I am not getting what I am supposed to get. In the above example, I have created a rectangular grid of size (x,y,z) 25,25,25 and grid spacing (dx,dy,dz) of 0.1,0.1,0.25 and assigned value 1 for points which are inside a sphere of radius 5, with center (x,y,z) at 12.5,12.5,12.5. For the rest of the points which are outside the sphere, I am assigned value of 0. So from the contour filter, I am expecting to get the same sphere as the output. But what I am getting is this:
I’m glad you are making progress. The data is most certainly bad. There are many ways to debug this, one of the simplest ways is to write the data out, and then use ParaView or SLicer to look at it. You can also write out to a legacy VTK files in text-readable form so you can examine it.
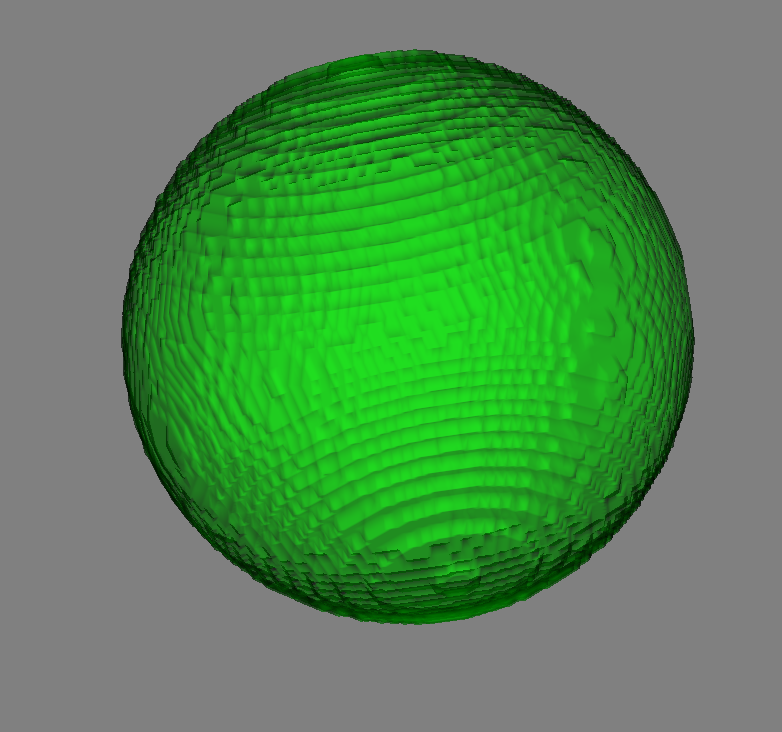
However, as you see the surface is very rough, is there any way to get a smooth sphere? @will.schroeder, @marcomusy, based on your experience, am I using the right method here?